A High-Performance Small-Animal PET/CT System
Received Date: August 16, 2023 Accepted Date: September 16, 2023 Published Date: September 19, 2023
doi: 10.17303/jber.2023.7.103
Citation: Yan Wang, Qingfeng Liu, Huiwen Mu, Shuping Xie, Wangxin Yu, Liyan Miao (2023) A High-Performance SmallAn imal PET/CT System. J Biomed Eng Res 7: 1-11
Abstract
Objective: To evaluate the PET performance of a high-performance small-animal PET/CT system (SuperNova III, model SNPC 304) developed by PingSeng Healthcare Inc
Method: The spatial resolution, noise equivalent count rate, scatter fraction, sensitivity, and image quality of the PET system were evaluated using the NEMA NU 4-2008 standard. The PET image resolution was demonstrated in a study with a Micro Derenzo phantom. In addition, the system was also assessed in tumor-bearing mice and SD rats by dynamic PET imaging in a single-bed whole-body scan with low -dose injection and short acquisition times
Results: The system achieved a spatial resolution of better than 1 mm (full width at half maximum) within the central 50 mm field of view (FOV). The measured noise equivalent count rate (NECR) was 342.1 kcps@36.4 MBq with a scatter fraction of 23.5% and 794.5 kcps@39.8 MBq with a scatter fraction of 10.9% for rats and mice, respectively. The NEMA absolute Sensitivity was measured to be 13.3%; image noise level 4.1%; recovery coefficients (RC) 0.10, 0.60, 0.89, 0.96, 0.92 for the 1 - 5 mm cylindrical rods, respectively; the spill over ratios (SOR) for water and air cold regions 5.6% and 4.5%, respectively. The PET image of the Micro Derenzo phantom showed that the 0.9 mm rods were clearly resolvable. In the imaging study of a tumor-bearing mouse with a 2-min scan at 1 h post injection of 68 µCi 18F-FDG, a high-quality image and accurate quantification has been obtained, indicating a high sensitivity of the system. In addition, the study in SD rats demonstrated that the system is suitable for performing whole-body dynamic imaging on rats in a single bed, with short scan time (2-5 mins) and low dose injection (40 µCi). In all cases, the acquired PET images were free of artifacts with accurate quantification in tracer uptake.
Conclusion: The SuperNova Micro PET/CT system had superior PET performance. It was demonstrated to be capable of whole-body dynamic imaging for mice and rats in a single bed with short scan time and low dose injection. Both PET image quality and quantification were satisfactory for imaging studies with small animals.
Keywords: PET/CT; Molecular Imaging; Performance Evaluation; NEMA NU 4-2008
Introduction
Small animal PET/CT imaging has become a widely used advanced technique in the field of medicine and bioengineering in recent years. Through functional and anatomical imaging of small rodents (mice or rats) in vivo, information about the subject's physiological condition and drug distribution can be derived. This information provides useful insight for the study of oncological, neurological, and cardiovascular diseases, and as well as for genetic research and preclinical pharmaceutical drug development using animal models.
Due to the size difference between humans and rodents, it is required that small animal PET should have higher performance than clinical PET, especially in spatial resolution and sensitivity, which can be accomplished by using smaller scintillation crystals, smaller detector ring diameter, and longer axial coverage. PingSeng Scientific has developed an advanced small animal PET/CT system - Super Nova III using silicon photomultiplier (SiPM) technology. The CT image from the system provides anatomical information for localization when fused with the functional PET image, and is also used for attenuation correction in PET image reconstruction. The system is characteristic of large transverse and axial field of view (FOV), suitable for whole-body dynamic studies with rats.
A SuperNova® III system (model SNPC-304) from PingSeng Healthcare was recently installed at the First Affiliated Hospital of Soochow University. This paper presents its PET performance using the industry standard NEMA NU 4-2008 [1].
Methods
The PET ring of Super Nova® III (model SNPC-304) adopted a modular design. This 92-crystal-ring system consists of 48 detector modules in total, four along axial direction and 12 in trans-axial plane. Each module comprises 23 23 cerium-doped yttrium-lutetium silicate (Ce: LYSO) scintillation crystals. The size of each LYSO crystal is 1.54 1.54 13.5 mm3 . The crystals form a ring of 14.7 cm in inner diameter. The pitch between crystals within each module is 1.64 mm, and the modules are closely packed with no additional spacing along axial direction, which makes an axial FOV of 15 cm. The cross-sectional FOV is determined to be 10 cm. Each detector module is coupled with 4 4 Silicon Photomultipliers (SiPM) to decode locations of Gamma photon interactions with crystals.
Spatial resolution is used to evaluate the capability of a PET system to resolve two adjacent points in a reconstructed image, which is typically, represented by Full Width at Half Maximum (FWHM) of the radioactivity regions in point source images.The NEMA NU 4-2008 standard specifies a 22Na positron-emitting point source with a diameter not exceeding 0.3 mm for the measurement of PET spatial resolution, and the intensity of the radioactive source must be low enough so that the dead time of the system is less than 5%. We used a 22Na source supplied by Eckert & Ziegler's (model MMS09). The radioactive area of the source is spherical in shape with a diameter of 0.25 mm at center. We positioned the source at 5, 10, 15, 25 mm off center radially in the central transverse plane and in the transverse plane off from the axial center by 1/4 axial FOV, and measured spatial resolution values at the eight locations, respectively. The energy window was set to 350 - 650 keV and the coincidence time window was set to 5.12 ns. At each location data was collected for 5 mins to ensure that at least 100,000 coincident events were collected. The data were interpolated into 3D sinograms, and then reconstructed with a FBP algorithm specified by the NEMA standard. The voxel size of the reconstructed image was 0.2 0.2 0.2 mm3. Due to the noise in the reconstructed images, however, FBP is not the preferred algorithm anymore in modern PET systems in practice. Instead, more advantageous iterative image reconstruction algorithms (for example, 3D-OSEM) combined with resolution recovery technique using point spread function (PSF) have been widely used in recent years. The PSF approach takes point spread function as prior knowledge and integrates it into an iterative process, leading to a relatively uniform spatial resolution across the whole FOV [2]. Therefore, we also reconstructed the point source data with an algorithm combining 3D-OSEM and PSF and presented the results in this paper.
The scatter fraction and count rate performance were measured using polyethylene (0.96g/cm3 ) cylindrical phantoms simulating geometries of mice and rats according to the NEMA standard. The mouse phantom was 25 mm in diameter and 70 mm long, with a 10 mm off-center cylindrical hole passing through the phantom. The rat phantom was 50 mm in diameter and 150 mm long, with a 17.5 mm off-center cylindrical hole passing through the phantom. The phantoms were centered within the field of view both transversely and axially. A line source of 2.5 mm in inner diameter was filled with 18F-FDG passing through the hole. During the PET scan, the energy window was set to 350 – 650 keV and coincidence time window to 5.12 ns. The total acquisition time was preset to 50,000 seconds to ensure that the true event loss was less than 1% and the random event rate was less than 1% of the true rate at the end of the acquisition.
The data was stored in a list-mode format and was then converted into dynamic sinograms using the single-slice rebinning algorithm (SSRB) [3]. Each sinogram had at least 500,000 coincidence counts. For each prompt sinogram (transaxial bin size: 0.82 mm; slice thickness: 0.82 mm), all pixels 8 mm away from the edge of the phantom were set to zero. Sinogram angular rows were then aligned with respect to the radial peaks and superimposed to form a single radial profile. The total counts within ± 7 mm of the peak of the radial profile was considered as the sum of scatter, random and true coincidence, while scatter and random coincidence counts beyond 7 mm off the peak. A linear interpolation between the left and right border of the 14-mm band was used to estimate these non-true counts under the profile peak.
Noise equivalent count rate (NECR) was defined as
where Rtrue is the estimated true coincidence rate and Rtotal collected total count rate. To calculate the scatter fraction, the count rate of scattered coincidence rate was derived,

where Rrandom was the random coincidence rate which was obtained from the delayed coincidences and Rintrinsic was the detector intrinsic background coincidences measured over a long period of time.
The scatter fraction was calculated as
SensitivityThe measurement of PET sensitivity was carried out with a 22Na source placed at the center of both transverse and axial FOV. The energy windows were set to 150 - 750 keV, 250 - 750 keV, and 350 - 650 keV, respectively, and the coincidence time window to 5.12 ns. Each scan lasted for 2 mins to ensure at least 10,000 true coincidence events were collected. The background data was acquired for 20 mins to ensure reasonable statistics.
Sensitivity was defined as
where Rtrue and Rb represent true and background coincidence count rate, respectively, A the true activity of the source.
Considering the positron branching ratio of 0.9060 for the 22Na source, the absolute sensitivity was calculated as:
An image quality phantom was designed according to the NEMA standard. The schematic diagram of the phantom was shown in Figure 1. The phantom was fabricated using 3D printing technology and was used to evaluate PET image quality and as well as quantitative accuracy of hot and cold regions.
The phantom mainly consisted of three axial functional sections:
- Hot rods in diameters of 1, 2, 3, 4, and 5 mm, respectively, used to test the activity recovery coefficients (RC).
- 30 mm uniform cylindrical section filled with FDG for testing noise level.
- A uniform cylindrical section filled with FDG with two cylindrical cold zones of 10 mm in diameter each, one with air and the other with water, for testing the accuracy of attenuation correction and scatter correction.
The phantom was filled with 102.7 µCi 18F-FDG. It was scanned by the CT first and then by the PET for 20 mins. The PET data was reconstructed using the system provided algorithm (3D-OSEM + PSF, 21 subsets and 5 iterations). The image voxel size was 0.4 0.4 0.4 mm3 and the reconstruction used the system-acquired CT image for attenuation correction.
On the reconstructed image, a cylindrical volume of interest (VOI) of 22.5 mm in diameter and 10 mm in length was drawn in section 2, and the standard deviation of voxel values divided by the mean voxel value within this ROI was calculated to represent the noise level (%STD). Image slices covering central 10 mm of hot rods in section 1 were averaged, and then Circular ROIs with twice diameter of the rods were drawn on the averaged image. The RC values for each of these hot rods were calculated using the max value within the corresponding ROI divided by the average voxel value within the VOI. For the water and air cold zones in section 3, a cylindrical ROI of 4 mm in diameter and 7.5 mm in length was drawn for each of the two zones and the ratio of the mean of each cold region to the mean of hot uniform area was reported as Spill-over Ratio (SOR).
Micro Derenzo PhantomA micro Derenzo phantom was used to qualitatively assess the system’s spatial resolution. There were six fan-- type regions, containing hot rods of 0.8, 0.9, 1.0, 1.1, 1.2, 1.3 mm in diameter, respectively. The distance between consecutive rods was twice the rod size. The phantom was printed with 3D technology. It was filled with ~349 µCi 18F FDG and scanned with the PET/CT system. The PET scanning duration was 90 mins and the CT image was used for the PET attenuation correction. The PET reconstruction was performed on a voxel grid of 0.25 0.25 0.5 mm3 using the system-provided 3D OSEM + PSF algorithm with 21 subsets and 50 iterations.
Small Animal Imaging in VivoA U87 tumor-bearing mouse weighing 22 g was fasted for 12 h before imaging and had free access to water. The mouse was injected with 18F-FDG (68μCi) into the tail vein after 2% isoflurane anesthesia, and the Super Nova® PET/CT system was used for data acquisition for 1 h after the injection. The anesthesia was maintained until the end of the scan which lasted 5 mins.
A four-week-old SD rat was fasted for 12 h before imaging and had free access to water. The rat weighed 105 g. After being anesthetized with 2.5% isoflurane, it was fixed on the scanning bed in the prone position. A single-bed PET scan was performed immediately after 18F-FDG (40 μCi) injection, and the scanning time was 60 mins.
The PET scans were conducted with a coincidence timing window set to 5.12 ns and energy window to 350 - 650 keV.The data was reconstructed on a voxel grid of 0.5 0.5 0.6 mm3 using the system-provided 3D-OSEM + PSF algorithm (21 subsets, 5 iterations). The CT images were used for the PET attenuation correction.
The U87 tumor-bearing mouse data was reconstructed into 30 s * 2 + 60 s + 180 s dynamic frames. The SD rat data was reconstructed into 5 s + 10 s + 15 s + 30 s + 60 s + 180 s + 300 s + 600 s * 5 dynamic frames.
The reconstructed dynamic images were analyzed using PMOD (version 4.3; PMOD Technologies). The mouse image was segmented for the heart, liver, kidney, and tumor as ROIs. The rat image was segmented for the brain, heart, liver, kidney, lung, and muscle as ROIs. The activity concentration values within the ROIs and the injected doses were used to obtain SUV mean values:
SUV = activity concentration (MBq/g) / injected dose per gram of body weight (MBq/g)
Spatial ResolutionThe spatial resolution values derived from the FBP algorithm were shown in Figure 2 (A). The value at 5 mm off center was about 1.6 mm and degraded as the distance from the center increased, which was expected due to the depth of interaction effect.
Modern commercial PET systems mostly use iterative reconstruction coupled with resolution recovery techniques such as modeling system’s PSF to enhance spatial resolution while controlling noise. The spatial resolution derived from 3D-OSEM + PSF was shown in Figure 2 (B). Uniform resolution of better than 1 mm was achieved within the center 50 mm of the FOV.
Scatter Fraction, Count Loss and Random CoincidenceThe peak NECR measured with a 350 – 650 keV energy window and 5.12 ns coincidence timing window was 342.1 kcps (peak dose 36.4 MBq) in rats and 794.5 kcps (peak dose 39.8 MBq) in mice. The scatter fractions were 23.5% and 10.9% for rats and mice, respectively. The NECR curve was shown in Figure 3.
SensitivityPer the NEMA standard, the data within the central 2 cm FOV were used for analysis, and the measured absolute sensitivities were 13.3%, 11.0% and 8.8% with the energy window set to 150 - 750 keV, 250 - 750 keV and 350 - 650 keV, respectively
Image Quality, Attenuation and Scatter Correction AccuracyThe reconstructed image of the image quality phantom was shown in Fig. 4. The results of recovery coefficients analyzed from Figure 4 (A) were listed in Table 1. The noise level of the uniform cylindrical background (Fig-ure 4 (B)) was 4.1%. From the analysis of Figure 4 (C), the spillover ratios of water and air cold areas were determined to be 5.6% and 4.5%, respectively.
Micro Derenzo PhantomThe reconstructed image of the Micro Derenzo phantom was shown in Figure 5, where the 0.9 mm rods were clearly resolvable.
Small Animal Imaging in VivoRepresentative PET/CT images of the U87 tumor-bearing mouse were shown in Figure 6 (A). The PET and CT images were accurately registered and fused. Even with a collection time as short as 30 seconds, the noise level in the PET images was acceptable, indicating the system’s high sensitivity. The SUV values in various regions of interest remained consistent with respect to data statistics of varying acquisition time length, demonstrating the system’s superior quantitative accuracy (Figure 6 (B)).
Representative maximum intensity projection (MIP) PET/CT images of the SD rat were shown in Figure 7 (A). The rat was intravenously injected with a 18F-FDG dose of 40 μCi and a single-bed whole-body dynamic imaging was performed immediately for 1 h. Fig. 7 (A) clearly demonstrated the tracer’s dynamic distribution, going from the injection site through tail vein (0 - 5 s) to the heart (5 - 10 s), then from the heart to liver, and then accumulating in the kidneys and bladder. The PET and CT images were accurately registered and fused. A good image quality was achieved even with an injection of only 40 μCi dose (instead of conventional 200 - 300 μCi [4]) and with an acquisition time as short as 5 s. With such low dose, accurate time activity curves of regions of interest were obtained from the reconstructed dynamic images of various acquisition times (Figure 7 (B)).
This paper evaluated the PET performance of a small-animal PET/CT system (SuperNova III Micro PET/CT, model SNPC 304) based on the NEMA NU 4-2008 standard.
When using a FBP algorithm the spatial resolution close to the center of the FOV was about 1.6 mm. As the dis- tance from the center increased, the radial resolution value increased due to the depth of interaction (DOI) effect as expected. When using the industry-preferred iterative reconstruction algorithm coupled with resolution recovery modeling, the system achieved a uniform resolution better than 1.0 mm within the center FOV at 50 mm in diameter. On a micro Derenzo phantom one can clearly resolve the 0.9 mm rods. The resolution recovery algorithm based on iterative reconstruction has become the mainstream algorithm on modern PET systems due to the desired signal-to-noise ratio.
Owing to its large axial coverage (15 cm) and high sensitivity (13.3%, compared to 8% for similar products on the market [5] [6]), on the one hand, the system was suitable for application of dynamic whole-body imaging of rats.
The system’s peak NECR of rats and mice were 342 kcps and 795 kcps, respectively, which are competitive on the market [5,6].
In terms of NEMA image quality, the noise level of the system was measured to be 4.1%, which was far better than 7% in [5] and 8% in [6] due to its high sensitivity. The quantitative evaluation showed that both recovery coefficients for the hot regions (better than 90% for 3 mm rods) and spill-over ratios for the cold regions (about 5%) were acceptable and similar to other products on the market.
From the application point of view, single-bed whole-body dynamic imaging is desirable. Typical systems on the market can usually only support that for mice. Due to its axial FOV, as large as 15 cm, the SuperNova III system can support that for rats as well. This is very beneficial in research and development for the pharmacokinetic and pharmacodynamics studies with rats, such as neuropsychiatric and cardiovascular drugs. On the other hand, this system’s high sensitivity enabled studies using extremely low radioactive doses (as low as tens of μCi for rats and a few μCi for mice) compared to much higher conventional doses [7]. This benefit can also be utilized equivalently in reducing the PET scan time and improving scanning efficiency for acceptable and equivalent image quality. Last but not least, the system’s high accuracy in quantitation is a very desirable feature in quantitative small animal imaging studies.
This work was supported by the National Natural Science Foundation of China (82104318), Key R&D Program of Jiangsu Province (BE2021644) and Jiangsu Provincial Medical Key Discipline (ZDXK202247).
- National Electrical Manufacturers Association (NEMA) (2008) Performance Measurements for Small Animal Positron Emission Tomographs (PETs). NEMA Standards Publication NU 4-2008. Rosslyn, VA: NEMA.
- Z Wang, W Yu, S Xie (2013) A dedicated PET system for human brain and head/neck imaging, in: 2013 IEEE Nuclear Science Symposium and Medical Imaging Conference (2013 NSS/MIC), Seoul 1-4.
- Daube-Witherspoon ME, Muehllehner G (1987) Treatment of axial data in three-dimensional PET. J Nucl Med 28: 1717-24.
- Werner, Rudolf A et al. (2019) Longitudinal 18F-FDG PET imaging in a rat model of autoimmune myocarditis. European heart journal. Cardiovascular Imaging 20: 467-74.
- N Belcari et al., (2017) NEMA NU-4 Performance Evaluation of the IRIS PET/CT Preclinical Scanner, IEEE Transactions on Radiation and Plasma Medical Sciences 1: 301-9.
- I Szanda et al. (2011) National Electrical Manufacturers Association NU-4 performance evaluation of the PET component of the NanoPET/CT preclinical PET/CT scanner. J Nucl Med 52: 1741-7.
- Nose N, Nogami S, Koshino K et al. (2021) 18FFDGlabelled stem cell PET imaging in different route of administrations and multiple animal species. Sci Rep 11: 10896.
FIGURE 1
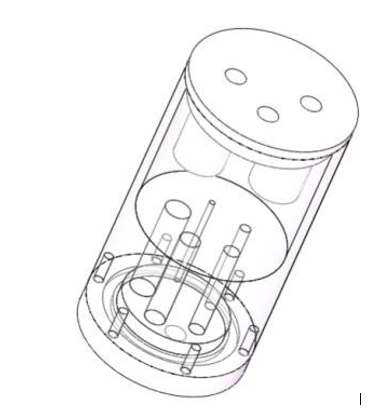
Figure 1: The schematic diagram of the NEMA image quality phantom
FIGURE 2
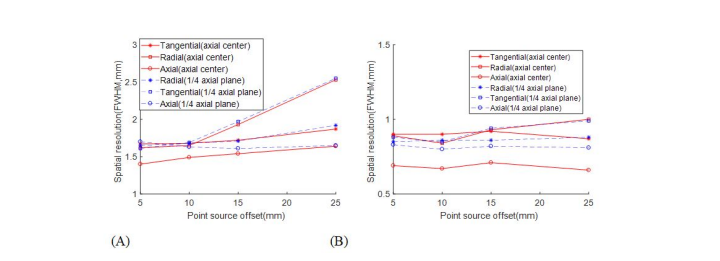
Figure 2: Spatial resolution results for: (A) FBP, (B) OSEM+PSF
FIGURE 3
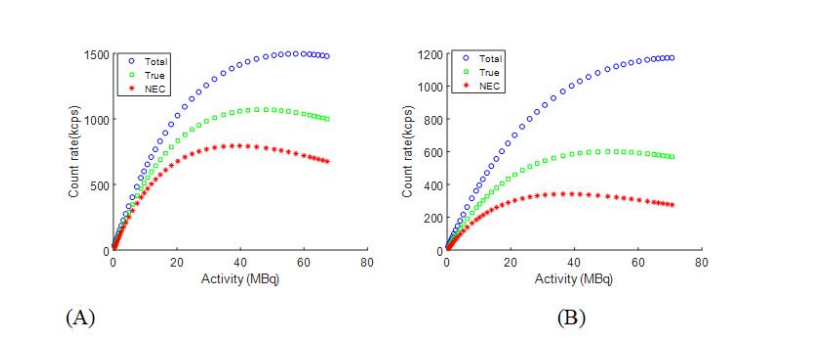
Figure 3: Results of Noise Equivalent Count Rate experiments for: (A) mouse-like phantom, (B) rat-like phantom
FIGURE 4
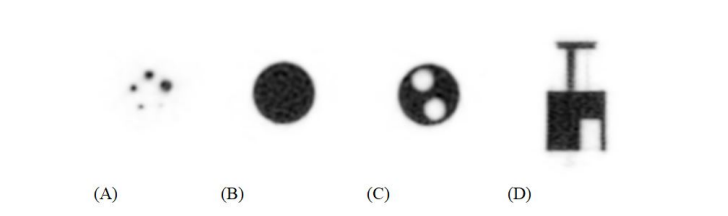
Figure 4: Reconstructed image of the NEMA image quality phantom: (A) a transverse slice of the 1, 2, 3, 4, 5 mm hot-rod regions; (B) a transverse slice of the uniform region; (C) a transverse slice ofthe cold region containing water and air; (D) a coronal slice of the phantom
FIGURE 5
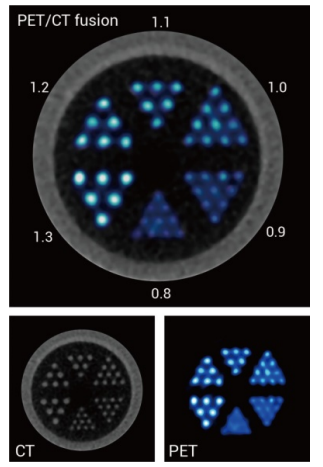
Figure 5: Images of the Micro Derenzo phantom. Top: PET/CT fused images; bottom-left: CT image; bottom-right: PET image
FIGURE 6
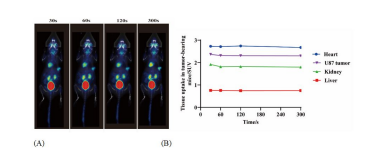
Figure 6: Micro PET/CT images of U87 tumor-bearing mouse with various acquisition durations 1 h after 18F-FDG (68 μCi) intravenous injection: (A) Coronal sectional images of tumor site with scan time of 0 - 30 s, 31 - 60 s, 61 - 120 s, and 121 - 300 s, respectively; (B) Time activity (SUV-mean value) curves of the heart, liver, kidney and tumor of the U87 tumor-bearing mouse
FIGURE 7
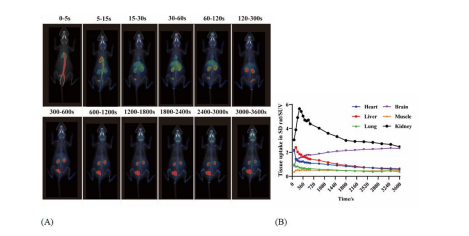
Figure 7: Dynamic PET/CT images of a SD rat after administrated with 40 μCi 18F-FDG:(A) Maximum intensity projection (MIP) fused PET/CT images with frames of 0 – 5 s, 5 - 15 s, 15 - 30 s, 60 - 120 s, 300 - 600 s, 600 - 1200 s, 1200 - 1800 s, 1800 - 2400 s, 2400 - 3000 s, 3000 - 3600 s; (B) Time activity curves of the heart, brain, liver, muscle, lung and kidney, derived from the reconstructed dynamic images of various acquisition times
Tables at a glance
Figures at a glance