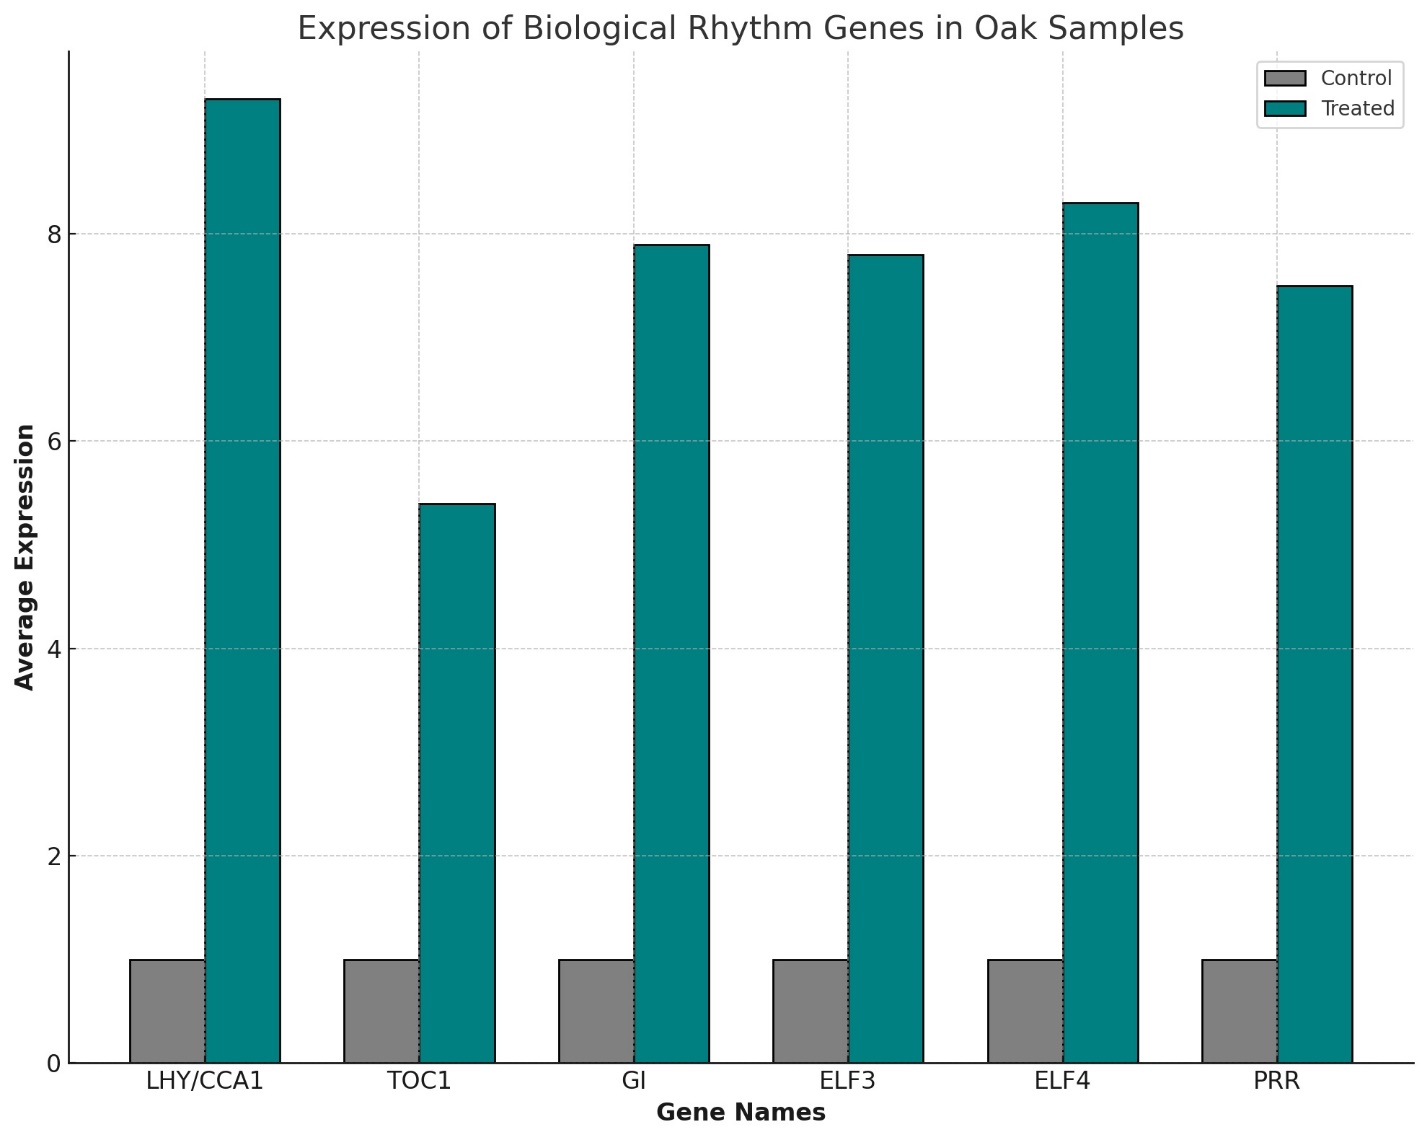
Figure 1: Expression of Biological Rhythm Genes in Oak Samples
Figure 1: Expression of Biological Rhythm Genes in Oak Samples
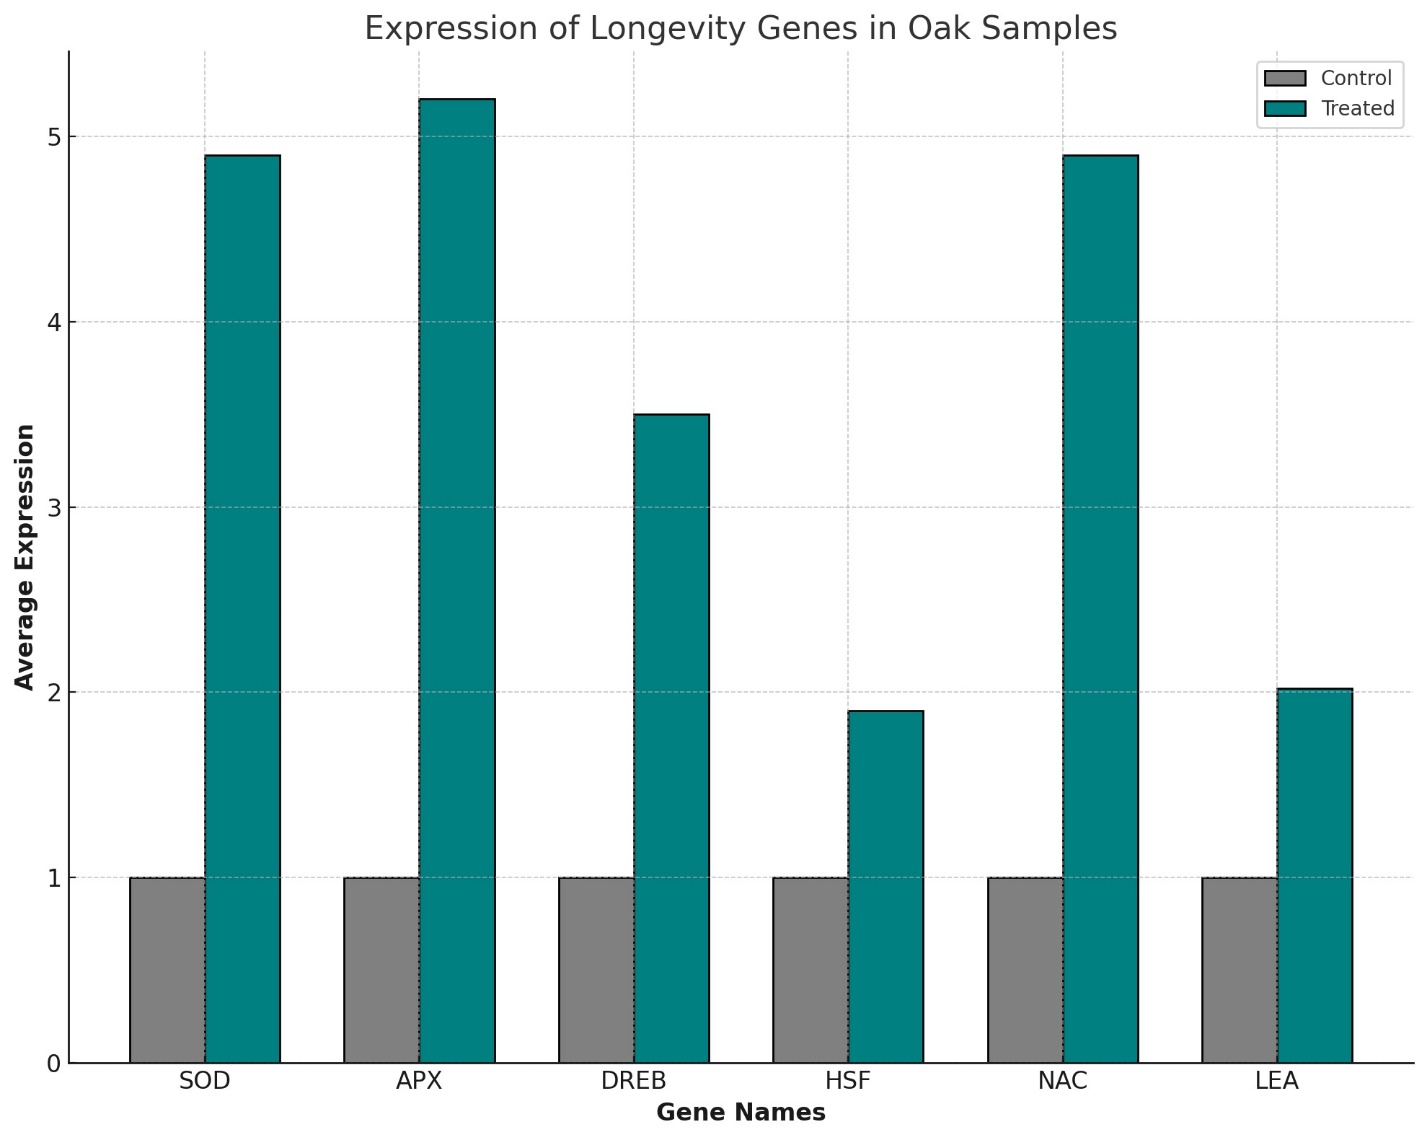
Figure 2: Expression of Longevity Genes in Oak Samples
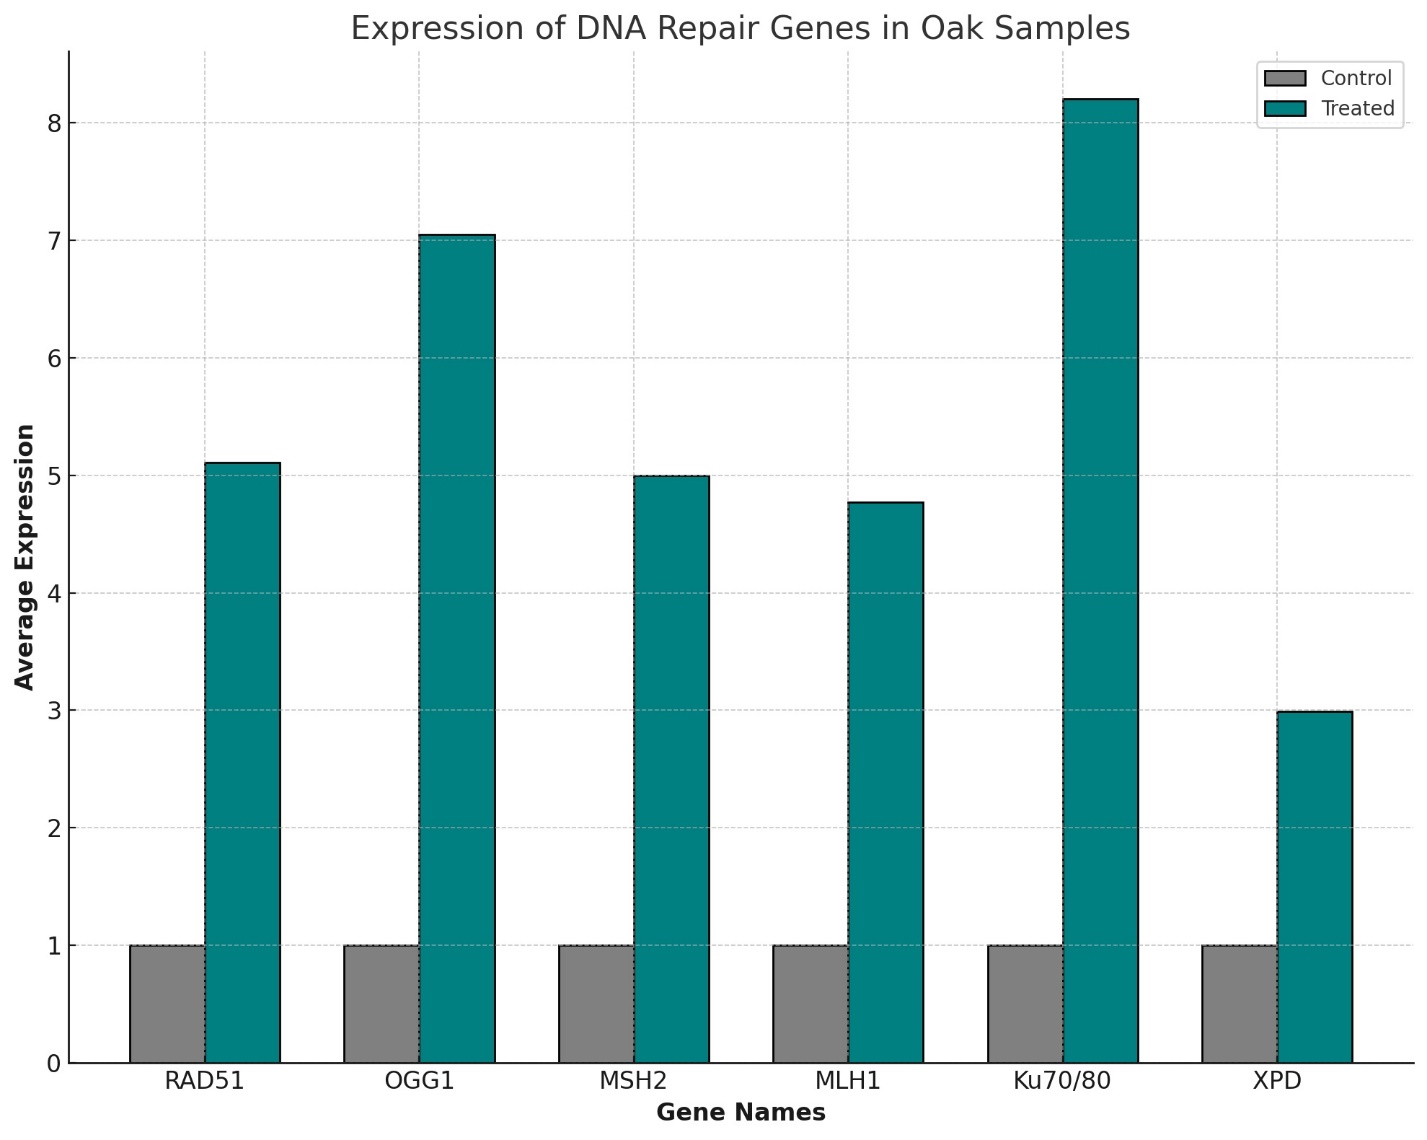
Figure 3: Expression of DNA Repair Genes in Oak Samples
Tables at a glance
Figures at a glance