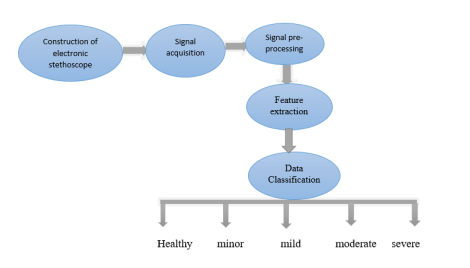
Figure 1: General block diagram of the method used
Figure 1: General block diagram of the method used

Figure 2: SG electret microphone
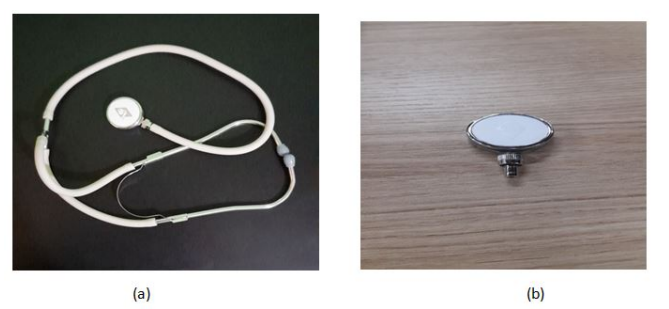
Figure 3: single head stethoscope with its extension (a), the separated stethoscope head (b)
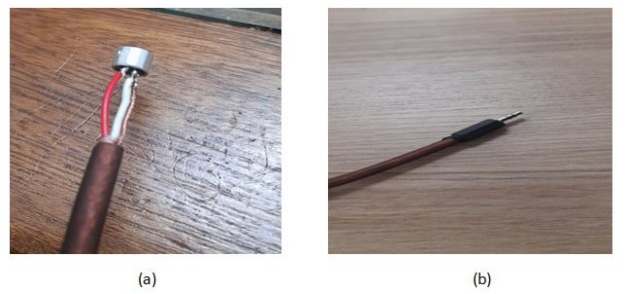
Figure 4: Sensor construction with microphone cable (a), unplugged stethoscope head (b)
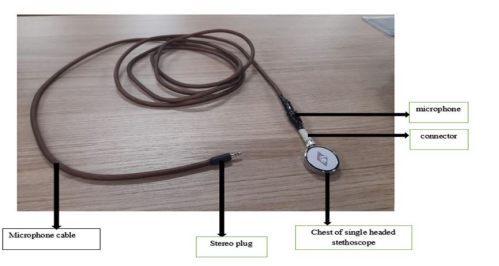
Figure 5: Designed electronic stethoscope
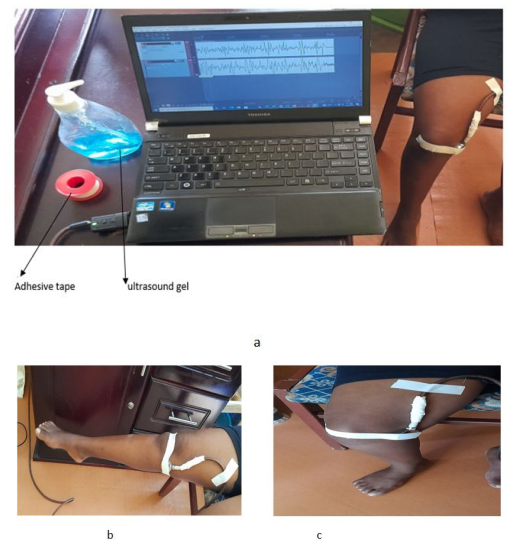
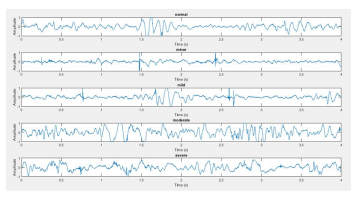
Figure 7: sample of knee joint signal at different stage (normal, minor, mild, moderate and severe)
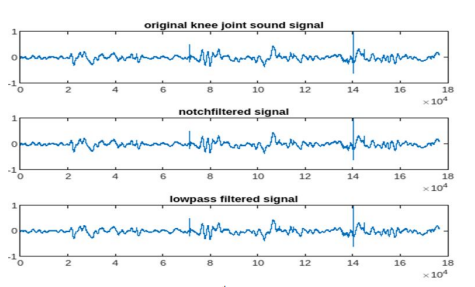
Figure 8: Filtered signal using 4th order Butterworth and notch filter
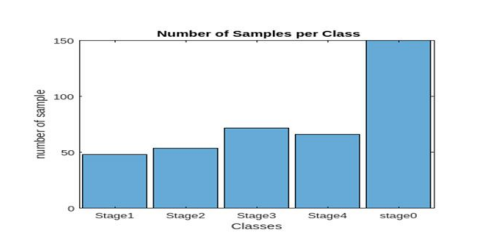
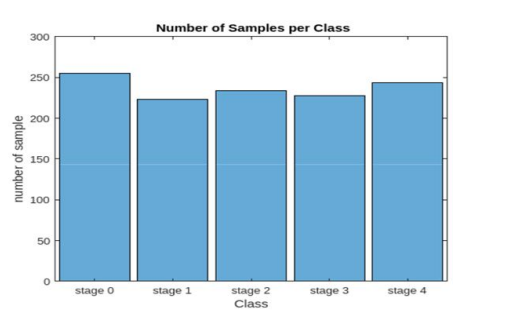
Figure 9: Training dataset of each class before performing class balance (a), and after performing class balance (b).
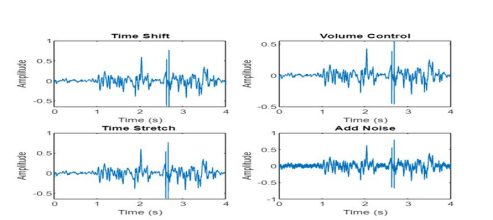
Figure 10: Augmented vibroarthrographic signal
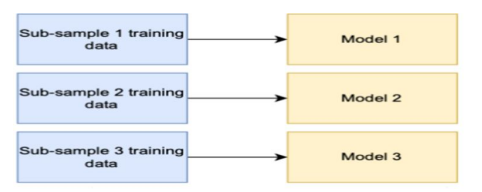
Figure 11: Training models of bagging ensemble method [70]
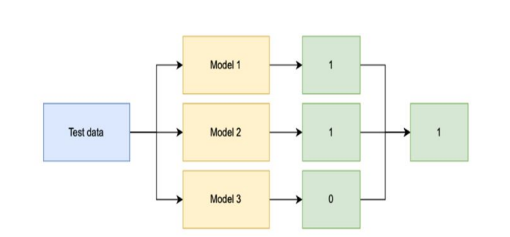
Figure 12: New data on bagging ensemble method

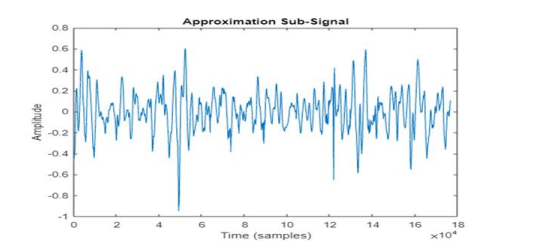
Figure 13: EWT of a signal
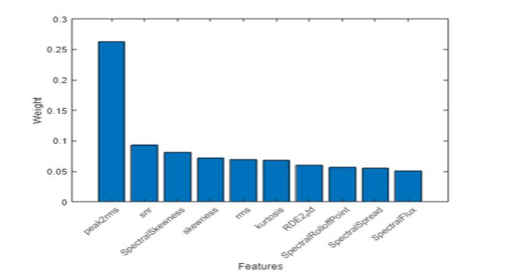
Figure 14: Selected features
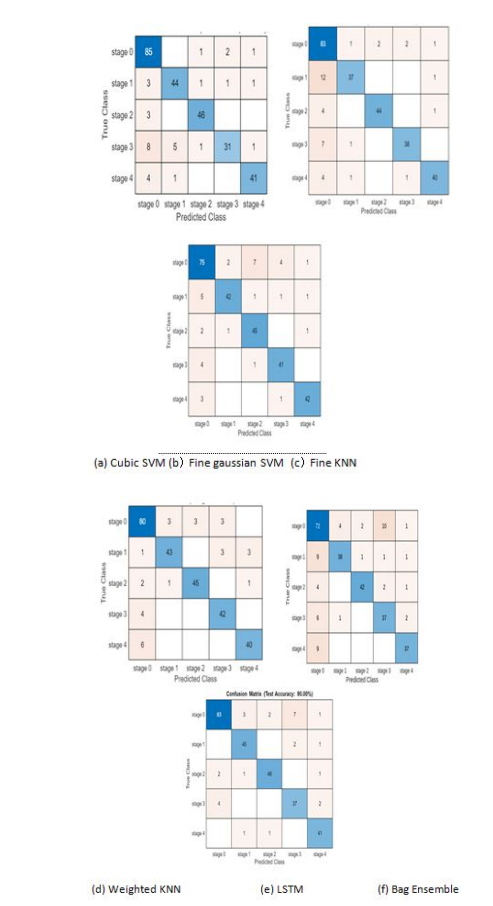
Figure 15: Confusion matrix of test set of different models
Tables at a glance
Figures at a glance