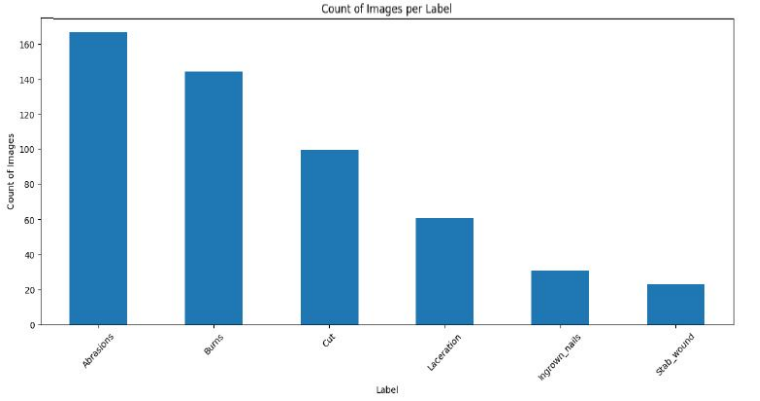
Figure 1: Wound Dataset Image Classification. (Count of Images per Label)
Figure 1: Wound Dataset Image Classification. (Count of Images per Label)
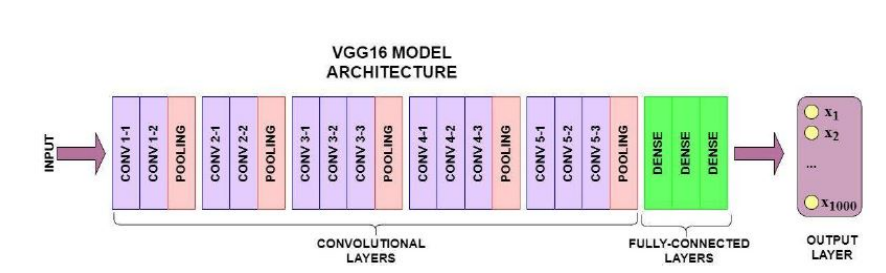
Figure 3: VGG16 Custom Layers. (VGG16 Model Architecture)

Figure 4: VGG16 Model Architecture. (Convolutional Layers)
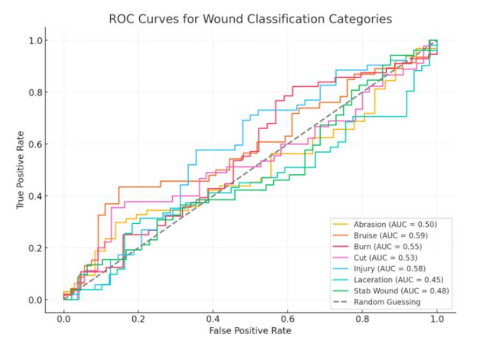
Figure 4: ROC curves for Wound Classification Categories.
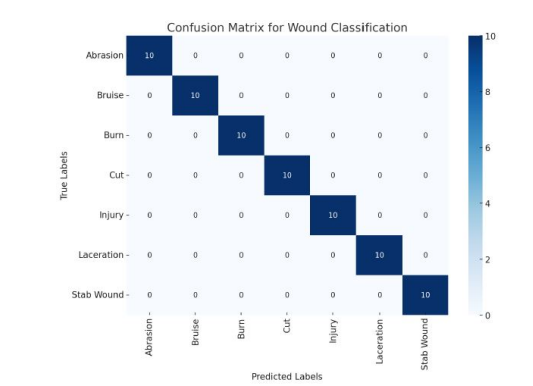
Figure 5: Confusion Matrix for Classification Of Wound Images. (True Labels, Predicted Labels)
Tables at a glance
Figures at a glance