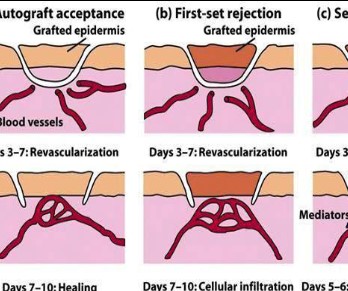
Figure 1: Schematic diagrams of the first and second stage transplant acceptance and rejection process
Figure 1: Schematic diagrams of the first and second stage transplant acceptance and rejection process
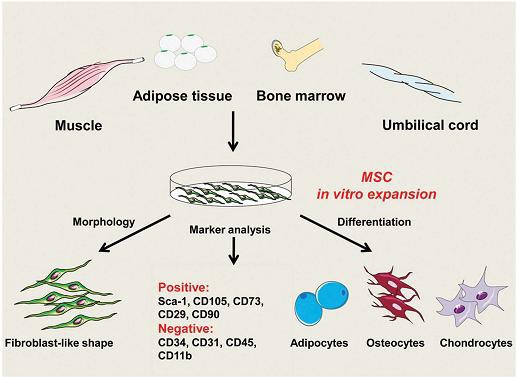
Figure 2: Properties of mesenchymal stem cells. - Figure 2 MSCs can be harvested from various tissues including fat, bone marrow, umbilical cord, muscle, and tooth roots. After expansion in vitro, they can be identified by several features: fibroblast-like morphology, expression of a group of markers: Sca-1, CD105, CD73, CD29, CD90, and lack of expression of: CD31, CD34, CD45, CD11b. In addition, MSCs have the potential to differentiate into adipocytes, chondrocytes, osteoblasts, and other cell types.
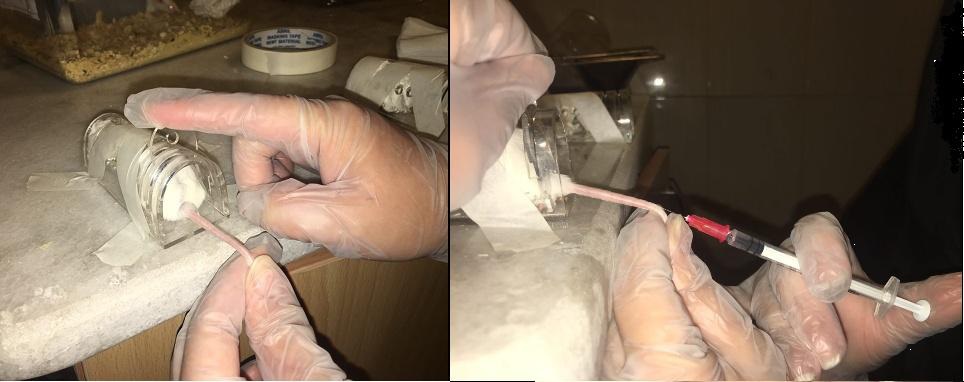
Figure 3: 3 Views of intravenous injection of mesenchymal stem cells into mice via the tail vein
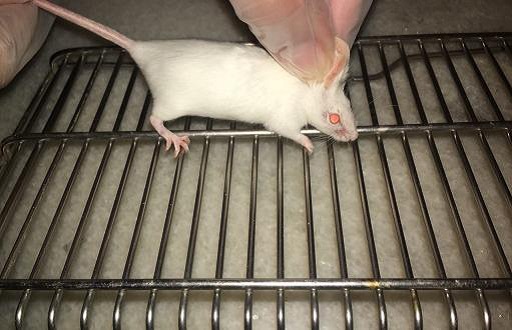
Figure 4: An illustration of how to perform cervical vertebra dislocation. When we grab the rat from behind, we quickly pull the animal's tail back sharply. This will cause the vertebra to dislocate and the animal to die quickly.
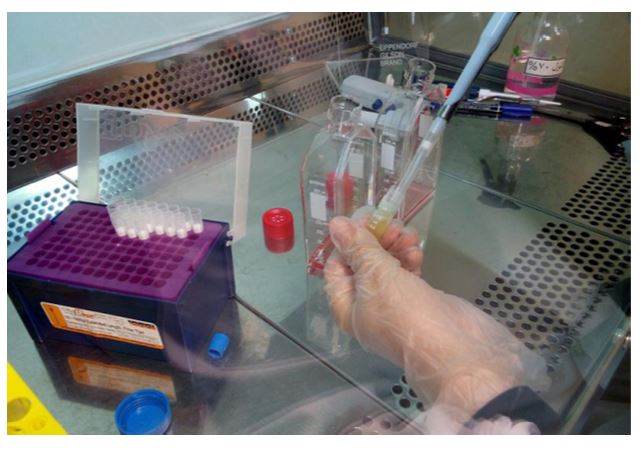
Figure 5: Transfer the thawed cells from the cryovial to a T75 flask. After partial thawing in a water bath, 1 ml of culture medium containing FBS is added to the cells. The cells are centrifuged, the supernatant is removed, and they are suspended in 1 ml of medium and divided between the flasks.
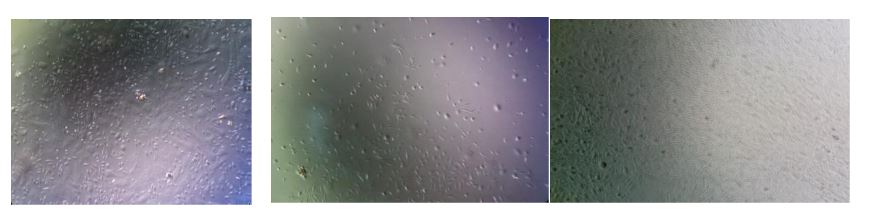
Figure 6: Inverted light microscope image of mouse bone marrow stromal cells at different passages with magnification - Figure 4 10x, image of cells numbered one to three, respectively, on different days from primary culture to 5-cell passage. Prepared by the author at the Jahad Daneshgahi Breast Cancer Research Institute.
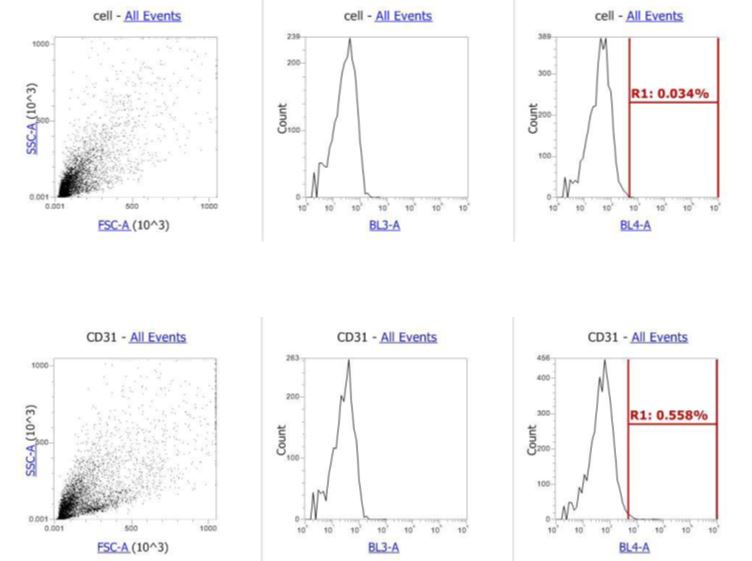
Figure 7: Flow cytometric evaluation of anti-mouse CD31-PE/CY7 antibody for mouse mesenchymal stem cells in passage, at which point the cells should not express CD31.
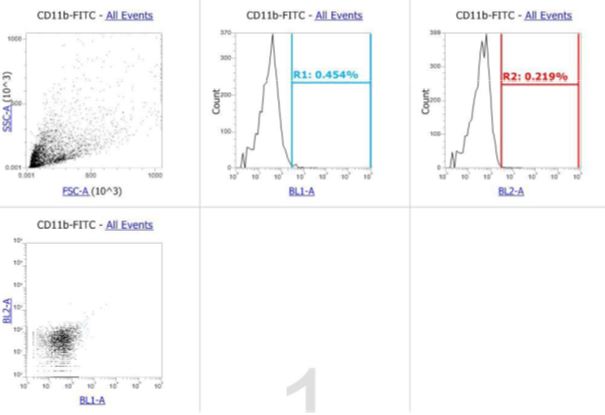
Figure 8: Flow cytometric evaluation of anti-mouse CD11b-FITC antibody for passaged mouse mesenchymal stem cells. Mesenchymal cells do not express this protein on their surface. Rat IgG2b and IgG2a isotype controls for FITC and PE dyes. Expression of these surface proteins on the surface of mesenchymal cells is positive.
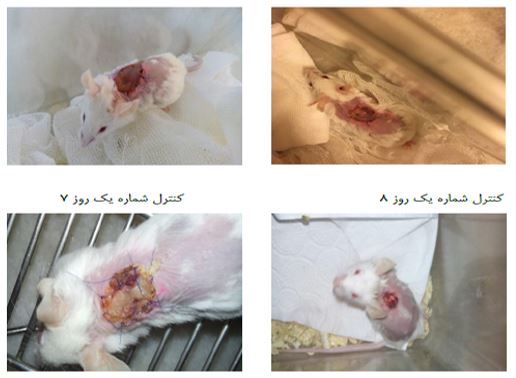
Figure 9: Control animal of the strain - Figure 4 Balb/C with C57bl/6 skin allograft without receiving cells. The images above show the time from the day of bandage removal to day 9 when the allograft was removed as an external wound crust.
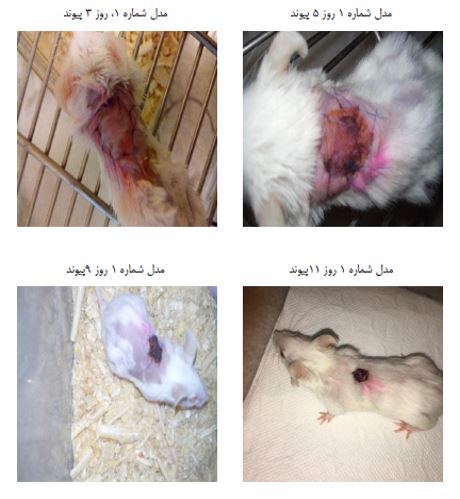
Figure 10: Model number one - Balb/C with C57bl/6 skin allograft, cell injection two days before allograft transplantation. Images from day three to complete graft rejection and detachment of the skin allograft on day nine and wound formation on day eleven.
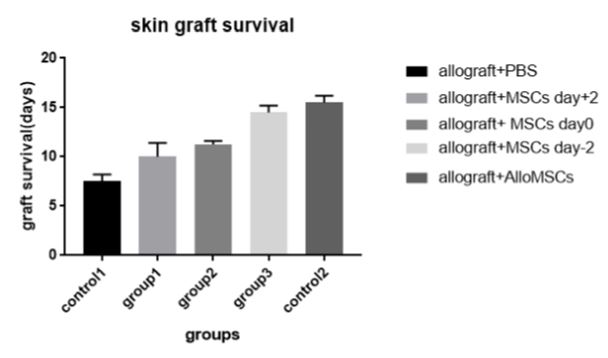
Figure 11: Diagram comparing graft survival days in different groups. Group 1: Balb/C mice - Figure 4 × 2 cells with skin allograft and injection of autologous mesenchymal2*106 two days before transplantation, Group 2: Balb/C mice: 2 autologous mesenchymal cells on the day of transplantation, Group 3 × 2 cells with skin allograft and injection of Balb/C mice 2 autologous mesenchymal cells two days after transplantation, Control 1: mice × 2 cells with skin allograft and injection of 136 Balb/C mice with skin allograft and injection of PBS on the day of transplantation, Control 2: C57BL/6 mice 2 cells with skin allograft and injection of 2*106 p value˂0.0 in all groups compared to control) Graftpad Prism software
Figures at a glance