Statistical Analysis of Plantar Foot Pressure Based on Anova
Received Date: May 16, 2025 Accepted Date: June 16, 2025 Published Date: June 19, 2025
doi:10.17303/jber.2025.9.103
Citation: Madhuri A. Thatte, Dr. Amruta Deshpande (2025) Statistical Analysis of Plantar Foot Pressure Based on Anova. J Biomed Eng Res 9: 1-9
Abstract
The human foot is a complex anatomical structure comprising 26 bones, 33 joints, and over a hundred muscles. It enables a wide range of movements, including walking, running, and balancing. The stance phase of gait includes heel strike, foot flat, mid-stance, and heel off. The complete walking cycle consists of heel strike, foot flat, mid-stance, heel off, toe off, and the swing phase.
This paper focuses on the characterization of the double support phase, during which both feet are in contact with the ground, bearing weight, and the body’s center of gravity is positioned between them. During this phase, the feet work in coordination to maintain balance and stability. A well-functioning double support system can help prevent injuries, improve balance, and enhance overall lower limb function.
The study includes analysis of pressure distribution in the plantar area of the foot and the changes caused by prolonged diabetic neuropathy. Furthermore, the findings can guide modifications to footwear soles to help redistribute or compensate for elevated pressure areas.
Keywords: Diabetic Neuropathy; Flexiforce Sensors; ANOVA Test; Human Foot; Diabetes Mellitus
Introduction
Diabetes mellitus is a chronic metabolic disorder characterized by elevated blood glucose levels. It arises when the body is unable to produce sufficient insulin or effectively utilizes the insulin it produces. Insulin, a hormone secreted by the pancreas, plays a key role in regulating blood sugar levels.
There are five main types of diabetes. Type 1 Diabetes is an autoimmune condition in which the immune system attacks and destroys insulin-producing beta cells in the pancreas. Type 2 Diabetes is the most prevalent form, accounting for approximately 90% of all cases. It is marked by insulin resistance and reduced insulin secretion. Gestational Diabetes is a temporary form of diabetes that occurs during pregnancy, typically in the second or third trimester. The LADA (Latent Autoimmune Diabetes in Adults) A slower-progressing form of Type 1 diabetes that develops in adults, usually after the age of 30.
The MODY (Maturity-Onset Diabetes of the Young) is a rare, hereditary form of diabetes caused by genetic mutations affecting insulin production.
Diabetic neuropathy is a common complication of diabetes and is generally classified into three types: reversible neuropathy, persistent symmetric polyneuropathy, and autonomic neuropathy. If left untreated, diabetic neuropathy can result in serious consequences such as foot ulcers and, in severe cases, amputation.
Neuropathy-related nerve damage is primarily caused by prolonged high blood sugar levels, which impair nerve function over time. This leads to symptoms such as numbness, tingling, pain, and muscle weaknesses, particularly in the feet and legs. When sensory nerves are affected, patients may lose the ability to feel pain, causing minor cuts or injuries to go unnoticed and potentially develop into serious infections.
Foot pressure analysis plays a vital role in the early detection and prevention of complications. This paper investigates plantar pressure distribution in various regions of the foot during standing, helping to identify abnormal pressure zones. Elevated pressure in specific areas, particularly the metatarsal region, can be managed using soft, flat inserts. These inserts act as localised cushions that compensate for the loss or displacement of the natural fat pad, distributing pressure more evenly across a larger surface area.
By identifying high-pressure zones, this research supports the development of customised footwear solutions that help redistribute pressure, prevent injuries, and improve overall foot health in individuals with diabetic neuropathy.
Dynamic analysis of various phases of the gait cycle was conducted by using FSR sensors on 11 adults. FSR is a polymer thick film transducer constructed with two layers of film substrate. Measurements are collected from 8 pressure points. Ambulatory monitoring was carried out to suggest alterations by using the scaphoid pad [1]. FSR using a Holter-based system developed for the study of Kinematics at the Knee and ankle joint, along with gait. A study has determined dynamic plantar foot pressure measurements at six points of the foot and joint kinematics in hemiplegic and diplegic children with planovalgus foot deformity.3D data on 17 feet was obtained [2].
Later on, a new sensor was developed MEMS sensor with elastic material to evaluate plantar pressure. Stainless steel was used as an elastic material to bear the load. This sensor provided another possibility of a force sensor for dynamic measurements [3]. A magnetic field-sensitive elastomer, a combination of magnetic particles and elastomer, designed to measure plantar foot pressure, was studied by implementing a study on young students with normal weight. The system was unable to recognise pressure on flat feet and about heavy subjects [4]. A study on static and dynamic plantar foot pressure was performed on 60 Chinese subjects based on foot scanner developed by the RScanner company. Static and dynamic assessment was performed on five pressure points on the foot. Correlation analysis was performed based on age and weight. After analysis, the main plantar pressure bearing zones seem to be transferring from the first metatarsal zone towards the fifth metatarsal zone as people age [5]. Pedobarographic-based Disability Analysis for Hemiplegic Patients of Different Weights using Foot Planter Pressure Sensors. Data of three hemiplegic patients compared with different parameters as weight, pressure and gait cycle. There was a difference in pressure between hemiplegic and normal subjects. Pressure changes between the second and third metatarsal heads were analysed based on the ANOVA test [6]. A low-cost plantar pressure distribution system was designed by using FSR sensors. Sensors were arranged in a matrix to evaluate pressure, but the resolution and sensitivity of the system were poor [7]. Biofeedback-based plantar pressure measurement system in which on auditory biofeedback, the subjects could effectively reduce the pressure to the designated levels for the target area of the sole. A study was done on 7 subjects with a history of rheumatoid arthritis. This paper showed that structural abnormality is associated with increased plantar foot pressure [8]. EMG-based the machine was used to analyse diabetic peripheral neuropathy. It concluded that gait was deviated from normal due to nerve damage and muscle weakness Data acquired from nine muscles in the lower extremity from both healthy individuals and patients with DPN disorder
System Architecture for Plantar Pressure Monitoring
A system developed using FlexiForce sensors to measure plantar foot pressure at four specific points. Measurements were taken from non-diabetic, controlled diabetic, and uncontrolled diabetic subjects. The collected data was then analyzed to study and compare variations in foot pressure across these groups.
Criteria for subject selection and Study design
The study was conducted on a total of 68 male subjects, categorized into three groups: 22 non-diabetic individuals, 19 controlled diabetic patients, and 27 uncontrolled diabetic patients. Diabetes was diagnosed based on WHO guidelines, with fasting blood glucose levels ≥120 mg/dL and postprandial levels >150 mg/dL.
Subjects with HbA1c levels below 5.6% were classified as non-diabetic, while those with HbA1c levels between 5.6% and 7% were considered controlled diabetics. Uncontrolled diabetes was identified by elevated HbA1c values above 7%, indicating poor long-term glycemic control.
To eliminate gender-related variation, only male subjects were selected. All participants were within the age range of 40 to 60 years and had a Body Mass Index (BMI) between 18 and 25 kg/m², calculated using the formula given below.
BMI = weight (kg) / [height (m)]²
Steps for measuring plantar pressure: -
1. The subject is instructed to stand in a balanced position with both feet placed on the transducer shoe.
2. The system is powered on, and the desired channel is selected—one channel at a time from the four available.
3. The display shows the voltage output corresponding to the pressure applied by the subject’s foot at specific sensor points on the shoe sole.
4. By comparing the displayed voltage with the standard calibration chart of the Flexi-Force sensor, the actual plantar pressure at each point can be determined.
5. Plantar pressure readings at standard points are recorded and analyzed to identify any abnormalities in the foot sole.
The graph above illustrates plantar pressure data measured at four key points: the Toe, First Metatarsal Head, Second Metatarsal Head, and Heel in normal, non-diabetic subjects. The pressure values range from 0 to 800 KPa. The X-axis represents the individual subjects, while the Y-axis indicates the corresponding plantar pressure in kilopascals (KPa).
The graph above presents plantar pressure measurements at four key regions of the foot: The Toe, First Metatarsal Head, Second Metatarsal Head, and Heel, recorded in normal (non-diabetic) subjects. Pressure values range from 0 to 800 kilopascals (KPa). The X-axis represents individual subjects, while the Y-axis denotes the corresponding plantar pressure in KPa.
This graph represents pressure at four points in uncontrolled diabetic patients. Pressure levels are elevated beyond 700Kpa.It ranges between 7500Kpa to 950Kpa. X axis shows subjects and Y axis shows pressure in KPa.
Stepwise Approach to One-Way ANOVA Analysis
1. Calculate group means
2. Calculate the overall mean (mean for all groups combined).
3. Calculate within each group the total deviation of each individual score from the group mean “within group variation”
4. Calculate the deviation of each group mean from the overall mean –between groupvariation
5. Calculate the ratio between-group variation to the within-group variation (F value).
6. If between-group variation is significantly greater than the within-group variation. then the difference between 2 groups is statistically significant P value <0.05
F = MST/MSE MST = SST/ p-1 MSE = SSE/N-p SSE = ∑ (n−1)
where,
F = Anova Coefficient
MSB = Mean sum of squares between the groups MSW = Mean sum of squares within the groups
MSE = Mean sum of squares due to error
SST = total Sum of squares
p = Total number of populations
n = The total number of samples in a population
SSW = Sum of squares within the groups SSB = Sum of squares between the group’s SSE = Sum of squares due to error
s = Standard deviation of the samples N = Total number of observations
Conclusion
A statistical analysis of the plantar foot pressure system using FlexiForce sensors can be employed to measure pressures at various points on the feet, helping assess neuropathy. It may be used to suggest suitable insole to redistribute the pressure. This system can assist in selecting appropriate footwear and predicting areas of elevated pressure on the feet of diabetic patients. The results of the analysis indicate that diabetic patients experience higher pressure at the metatarsal heads compared to normal subjects.
- Ziad O. Abu-Faraj, Gerald F. Harris, An-Hsiung Chang, Michael J. Shereff (1996) Evaluation of pedorthic plantar pressure measurement with scaphoid pad application.
- Ziad O. Abu-Faraj, Gerald F. Harris, Peter A. Smith (2001) “Surgical Rehabilitation of the Planovalgus Foot in Cerebral Palsy” IEEE in Transactions on Neural systems and rehabilitation, 9.
- Zhang Xuefeng, Zhao Yulong, Xu Yi (2010) “Design and Development of a Novel MEMS Force Sensor for Plantar Pressure Measurement” in Third International Conference on Advances in Circuits, Electronics and Micro-electronics.
- Tiejun Tan (2012) “Measurement and Analysis of Dynamic Distribution of Plantar Pressure” in 5th International Conference on BioMedical Engineering and Informatics.
- Kirti Garg, Saurabh Mittal, M. Meenalakshmi (2016) “Pedobarography based Disability Analysis for Hemiplegic Patients of Different Weights using Foot Planter Pressure Sensors” in IEEE International Conference on Recent Trends in Electronics Information Communication Technology, 20-1.
- Bochen Li, Yi Liu, Weihao Li, Shengqiang Xu, Xianjun Yang, Yining Sun (2018) “Foot Plantar Pressure Measurement System Based on Flexible Force-Sensitive Sensor and its Clinical Application.” IEEE 3rd Advanced Information Technology, Electronic and Automation Control Conference.
- Jie-Wen Li, Duo-Jin Wang, Ji-Ming Ying, Wen-Ming Chen (2019) “Biofeedback-Informed Walking Strategy for Partial Foot Unloading in Able-Bodied Subjects “in 12th international congress on image and signal processing.
- Safi Ullah, Kamran Iqbal (2020) “A Preliminary Review on EMG Signals for Assessment of Diabetic Peripheral Neuropathy Disorder.” 7th International Conference on Electrical and Electronics Engineering.
- Prof. Saurin R. Shah, Dr. K. M. Patil (2005) “Processing of foot pressure images and display of an advanced clinical parameter PR in Diabetic Neuropathy”, in 9th International Conference on Rehabilitation Robotics.
- R Wright, L. Keith (2014) "Wearable Technology: If the Tech Fits, Wear It," Journal of Electronic Resources in Medical Libraries, 11: 204-16.
- Mothiram K Patila, Vasanth Bhat, Mahesh M. Bhati, Parivalavan R' Narayanamurthy VB, Ganesan VS (1997) “New Methods and Parameters for Dynamic Foot Pressure Analysis in Diabetic Neuropathy.”,in IEEE.19th International Conference, 1826-9.
- Tiejun Tan (2012) Department of Forensic Science and Technology China Criminal Police University Shenyang “Measurement and Analysis of Dynamic Distribution of Plantar Pressure” in international conference in biomedical Engineering.
- Ching-Mei Chen, Kosy Onyenso, Guang-Zhong Yang, Benny Lo (2015) “A Multi-Sensor Platform for Monitoring Diabetic Peripheral Neuropathy” in IEEE.
- Yuto Mibae, Hiroshi Noguchi (2022) “Visualization System of 3D Foot Plantar Model with Temperature Information Using RGB-D and Thermography Cameras for Prevention of Foot Ulcer in Diabetic Patients”in 2022 IEEE/SICE International Symposium on System Integration.
- C. Leboss´e, B. Bayle, M. de Mathelin Illkirch, P. Renaud LGeCo (2008) INSA-Strasbourg “Nonlinear Modeling of Low-Cost Force Sensors, in IEEE International Conference on Robotics and Automation, May 19-23.
- L. Wafai, A. Zayegh, J. Woulfe, S. Aziz and R. Begg (2015) "Identification of Foot Pathologies Based on Plantar Pressure Asymmetry", Sensors, 15: 20392-408.
FIGURE 1
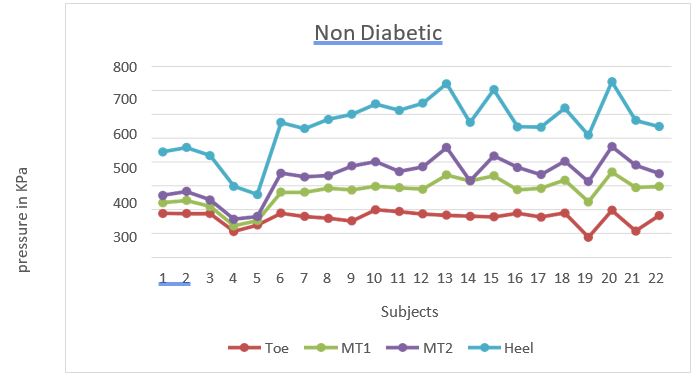
Figure 1: Non-diabetic Subjects
FIGURE 2
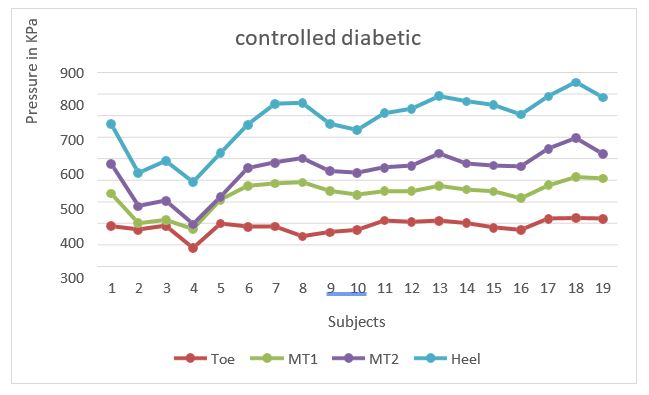
Figure 2: Controlled diabetic subjects
FIGURE 3
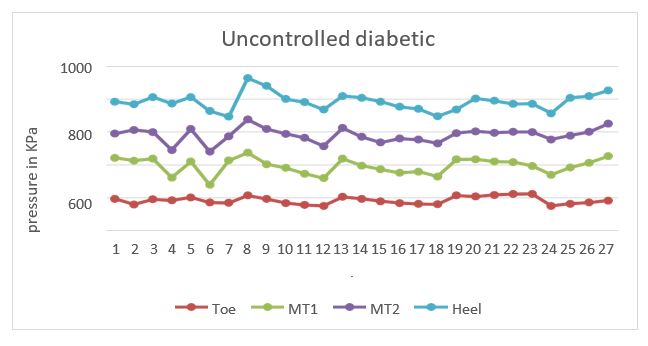
Figure 3: Uncontrolled Diabetic subjects
FIGURE 4
Calculations and Readings
Tables at a glance
Figures at a glance