|
PATIENTS |
HEALTHY PARTECIPANTS |
|
Median (IQR) or Absolute Count |
Range |
Median (IQR) or Absolute Count |
Range |
MALE |
36 |
|
5 |
|
FEMALE
AGE (YEARS) |
12
61(18) |
39 - 83 |
6
50 (15) |
35 - 62 |
BMI (KG/M2)
ALT (U/L) |
24,2(5)
32(18,8) |
18 - 36
11,1 - 282 |
22,9 (5,2)
19 (9,6) |
20,3 – 27,8
12 – 27,5 |
AST (U/L)
GGT(U/L) |
35,5(32,9)
45(50,6) |
16 - 190
12 - 221 |
17(6,7)
16(5) |
10,3 - 21
10 -25 |
ALKALINE PHOSPHATASE (U/L) |
95(37,2) |
64 - 138 |
73(31,3) |
45 - 89 |
PLATELETS COUNT (103/L) |
211(88) |
108 - 328 |
268(42) |
230-335 |
Table 1:Patients and Healthy Partecipants characteristics.Data are reported as medians and ranges or as absolute count. BMI: body mass index. ALT: alanine transaminase. AST: aspartate transaminase. GGT: gamma gluthamyl synthetase.
|
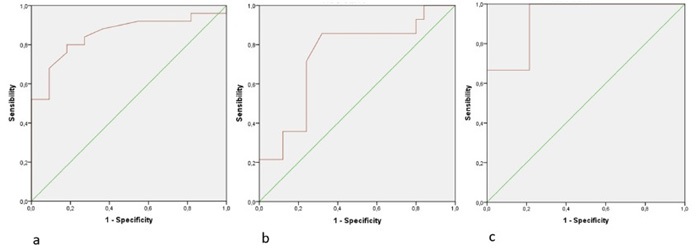
F≥2 |
F≥3 |
F=4 |
Cut off (kPa) |
6,2 |
7,65 |
13 |
Sensitivity (%) |
80 |
86 |
100 |
Specificity (%) |
82 |
68 |
79 |
AUROC (95% CI) |
0,85 (0,73 – 0,98) |
0,74 (0,57 – 0,91) |
0,93 (0,83 – 1) |
Table 2: Operative characteristics of shear-wave elastography in predicting fibrosis stages