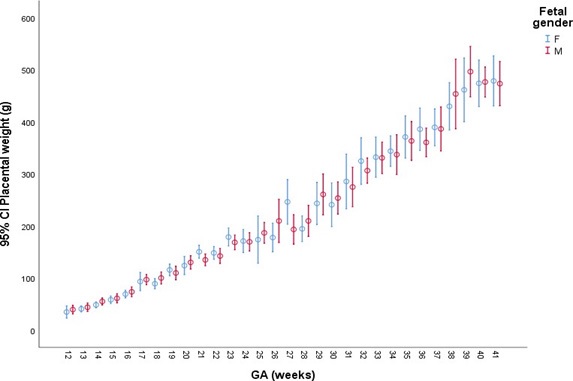
Figure 1 Meanandrespective95%confidenceintervalsforplacentalweightaccording to fetal gender for each GA.
Figure 1 Meanandrespective95%confidenceintervalsforplacentalweightaccording to fetal gender for each GA.
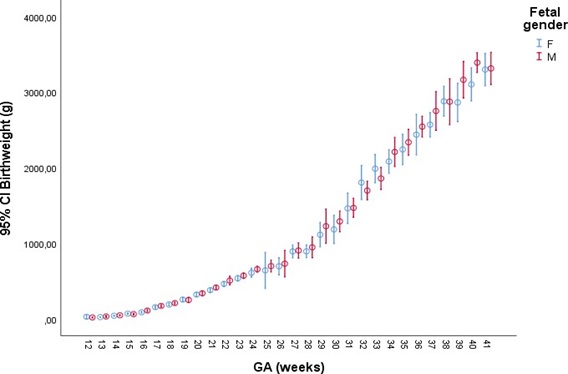
Figure 2 Mean and respective 95% confidence intervals, for the birth weight according to the fetal gender for each GA.
Legend: CI, confidence interval; g, grams; GA, gestational age; F, female; M, male.
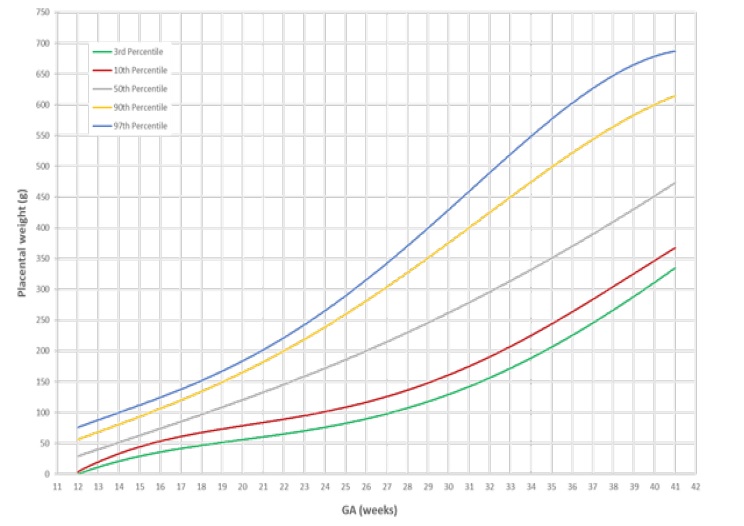
Figure 3Placental weight percentile curves by gestational age, Nogueira R, et al., Portugal, Porto, Embryofetal Pathology Laboratory.
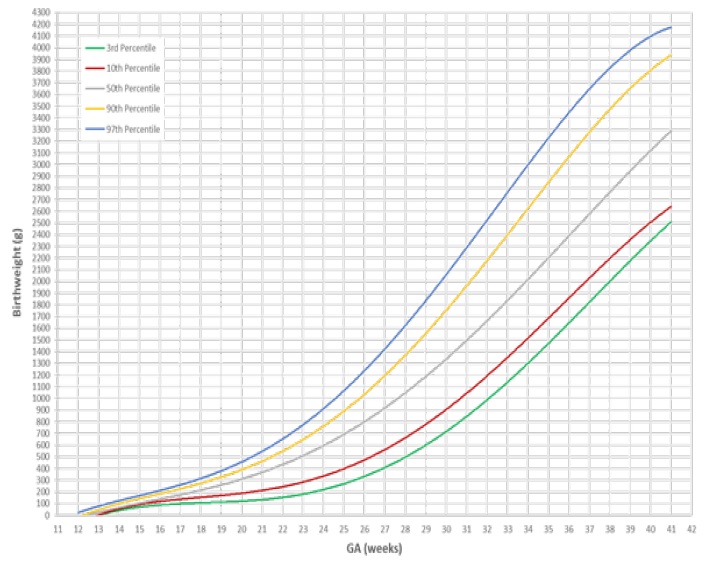
Figure 4Birthweight percentile curves by gestational age, Nogueira R, et al. Portugal, Porto, Embryofetal PathologyLaboratory.
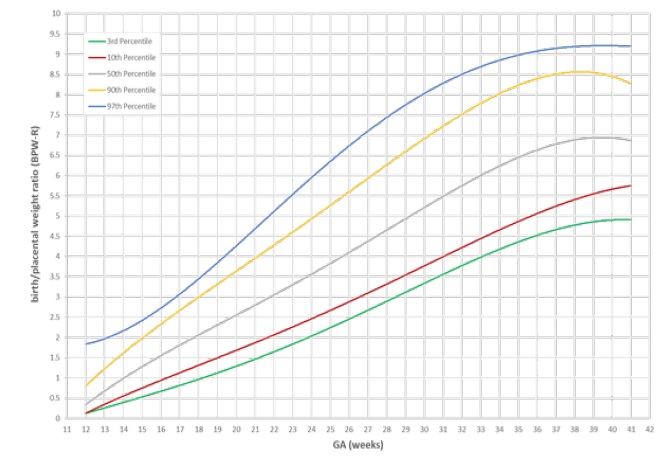
Figure 5Birth/placental weight ratio percentile curves by gestational age, Nogueira R, et al., Portugal, Porto, Embryofetal Pathology Laboratory.
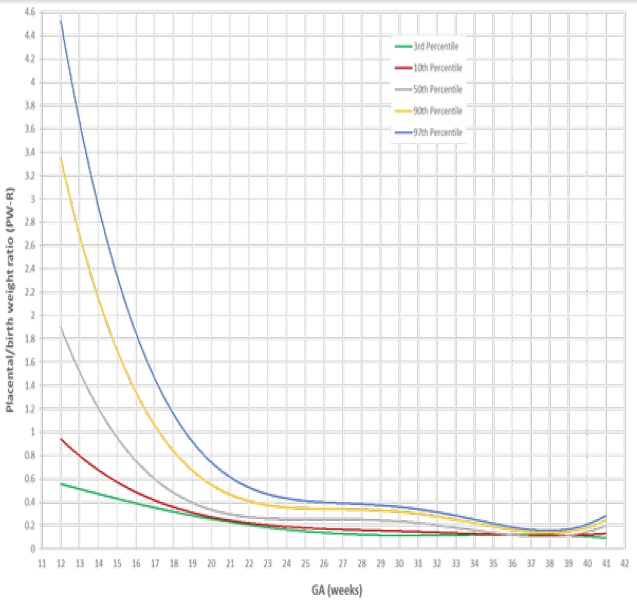
Figure 6Placental/birth weight ratio (PW-R) percentile curves by gestational age, Nogueira R, et al., Portugal, Porto, Embryofetal Pathology Laboratory.
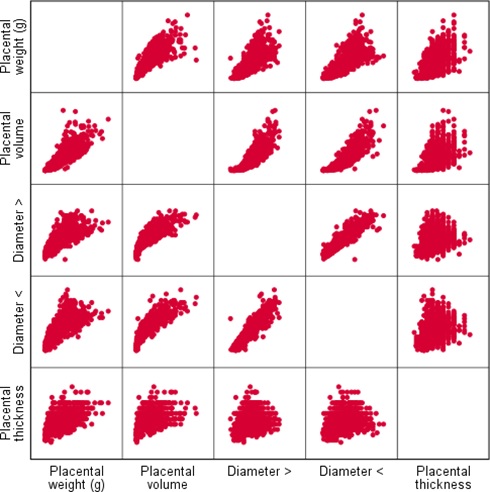
Figure 7Relation between placental measures.
Legend: g, grams; Diameter >, largest placental diameter; Diameter <, smallest placental diameter.
|
Valid (N) |
Mean |
SD |
Median |
Min |
Max |
MA (y) |
1947 |
31.8 |
6.1 |
32.1 |
15.1 |
48.2 |
GA (w) |
1951 |
27 |
9 |
26 |
12 |
41 |
PW (g) |
1951 |
233.25 |
159.25 |
195.00 |
6.00 |
995 |
PD (cm) |
1949 |
13.5 |
5.0 |
13.0 |
1.7 |
32.0 |
PT (cm) |
1947 |
2.11 |
.70 |
2.00 |
.30 |
5.50 |
FW (g) |
1951 |
1248.70 |
1153.93 |
766.00 |
5.40 |
4880 |
Table 1. Summary statistics for some important fetal, placental and maternal quantitative variables
Legend: SD, standard deviation; Min, minimum; Max, maximum; MA, maternal age; GA, gestational age; PW, placental weight; PD, placental diameter; PT, placental thickness; FW, fetal weight; y, years; w, weeks; g, grams; cm, centimeters.
|
|
N |
Percent |
Mother Parity |
1 |
820 |
45.2% |
|
2 |
595 |
32.8% |
|
3+ |
400 |
22.0% |
|
Total |
1815 |
100.0% |
Fetal Gender |
F |
818 |
47.7% |
|
M |
884 |
51.5% |
|
A |
13 |
.8% |
|
Total |
1715 |
100.0% |
Placental Shape |
Normal |
1731 |
88.7% |
|
Bilobed |
113 |
5.8% |
|
Circumvallate |
104 |
5.3% |
|
Membranacea |
3 |
.2% |
|
Total |
1951 |
100,0% |
Table 2. Summary statistics for some important fetal, placental and maternal qualitative variables
Legend: F, female; M, male; A, ambiguous.
Percentile |
|
|
|
Placental weight (g) |
||||
GA |
3rd |
10th |
50th |
90th |
97th |
Number |
Mean |
SD |
12 |
10 |
13 |
33 |
67.3 |
96 |
53 |
36.72 |
23.93 |
13 |
10 |
21 |
38 |
60 |
74 |
61 |
40.79 |
17.29 |
14 |
20.6 |
30 |
49.5 |
75 |
88 |
68 |
51.22 |
17.96 |
15 |
16 |
36 |
58 |
90 |
108 |
72 |
60.03 |
23.53 |
16 |
23.8 |
43 |
71 |
100 |
108 |
72 |
71.36 |
25.04 |
17 |
44 |
57 |
89 |
126 |
160 |
69 |
95.39 |
38.05 |
18 |
51.3 |
60 |
95 |
132 |
149 |
73 |
95 |
32.49 |
19 |
41 |
68 |
114 |
160 |
169 |
72 |
113.39 |
35.67 |
20 |
57 |
83 |
120 |
166 |
190 |
69 |
126.69 |
45.79 |
21 |
68 |
103 |
143.3 |
184 |
200 |
71 |
141.89 |
35.44 |
22 |
74 |
104 |
141 |
191 |
220 |
71 |
145.28 |
39.37 |
23 |
88 |
123 |
174 |
223 |
243 |
72 |
172.19 |
44.78 |
24 |
97 |
107 |
153.5 |
241 |
260 |
68 |
170.6 |
55.81 |
25 |
74 |
82 |
184 |
270 |
330 |
48 |
181.94 |
69.42 |
26 |
88 |
100 |
190 |
288 |
319 |
43 |
190.67 |
71.35 |
27 |
76 |
131 |
238.65 |
289 |
291 |
35 |
220.3 |
73.23 |
28 |
96 |
123 |
202 |
307 |
351 |
61 |
203.38 |
67.66 |
29 |
134 |
154 |
240 |
365 |
434 |
43 |
254.84 |
89.83 |
30 |
99.6 |
151 |
247 |
345 |
423 |
47 |
249.1 |
77 |
31 |
114 |
145 |
293.5 |
405 |
462 |
56 |
280.46 |
90.97 |
32 |
182 |
203 |
307 |
471 |
512 |
67 |
314.61 |
89.16 |
33 |
190 |
222 |
334.5 |
442 |
515 |
72 |
336.67 |
88.37 |
34 |
195 |
253 |
344 |
448 |
496 |
72 |
341.94 |
84.01 |
35 |
200 |
237 |
356 |
546 |
654 |
75 |
374.79 |
123.68 |
36 |
237 |
267 |
350 |
490 |
515 |
77 |
361.16 |
80.6 |
37 |
242 |
275.3 |
364.5 |
507 |
593 |
72 |
380.02 |
91.21 |
38 |
273 |
296 |
405 |
590 |
755 |
72 |
433.61 |
136.89 |
39 |
259 |
312 |
444 |
610 |
678 |
71 |
450.38 |
128.09 |
40 |
335 |
378 |
459 |
580 |
632 |
77 |
475.44 |
90.66 |
41 |
327 |
353 |
470 |
615 |
690 |
72 |
478.18 |
105.99 |
Table 3. Percentiles, number of observations, the mean and standard deviation for placental weight in the function of GA
Legend: GA, gestational age; g, grams; SD, standard deviation. Nogueira R, et al.,Portugal, Porto, Embryofetal Pathology Laboratory.
Percentile |
|
|
|
Birthweight (g) |
||||
GA |
3rd |
10th |
50th |
90th |
97th |
Number |
Mean |
SD |
12 |
5.7 |
9.3 |
16 |
29 |
111 |
53 |
23.83 |
38.99 |
13 |
6.7 |
16 |
27 |
41 |
46 |
61 |
28.22 |
20.96 |
14 |
16 |
24 |
46 |
70 |
77 |
68 |
44.72 |
17.3 |
15 |
15 |
24 |
70.5 |
100 |
120 |
72 |
67.86 |
32.27 |
16 |
25 |
44 |
99.35 |
164 |
185 |
72 |
99.8 |
44.33 |
17 |
75 |
89 |
166 |
226 |
266 |
69 |
165.63 |
51.58 |
18 |
66.5 |
122 |
209 |
261 |
309 |
73 |
201.52 |
56.84 |
19 |
56 |
127 |
261 |
333 |
402 |
72 |
253.83 |
86.96 |
20 |
141 |
242 |
325 |
430 |
455 |
69 |
330.38 |
81.85 |
21 |
190 |
296 |
409 |
497 |
535 |
71 |
400.56 |
86.21 |
22 |
241 |
353 |
495 |
589 |
648 |
71 |
486.48 |
141.64 |
23 |
325 |
411 |
565.5 |
700 |
772 |
72 |
560.09 |
109.35 |
24 |
343 |
444 |
642.5 |
786 |
854 |
68 |
637.79 |
143.32 |
25 |
179 |
280 |
731 |
870 |
1175 |
48 |
678.61 |
332.26 |
26 |
364 |
460 |
640 |
925 |
1670 |
43 |
710.84 |
293.23 |
27 |
488 |
620 |
958 |
1150 |
1200 |
35 |
911.78 |
192.51 |
28 |
300 |
549 |
960 |
1240 |
1400 |
61 |
928.62 |
270.84 |
29 |
497 |
638 |
1075 |
1720 |
2160 |
43 |
1203.65 |
488.27 |
30 |
660 |
845 |
1275 |
1730 |
1860 |
47 |
1267.34 |
349.7 |
31 |
796 |
920 |
1469.5 |
1930 |
2180 |
56 |
1479.11 |
358.7 |
32 |
937 |
1219 |
1750 |
2250 |
2500 |
67 |
1759.27 |
487.78 |
33 |
1177 |
1500 |
1960 |
2360 |
2490 |
72 |
1931.08 |
391.98 |
34 |
1331 |
1515 |
2095 |
2690 |
2860 |
72 |
2136.57 |
443.36 |
35 |
1530 |
1720 |
2270 |
2850 |
3640 |
75 |
2337.69 |
561.11 |
36 |
1640 |
1860 |
2440 |
3175 |
3390 |
77 |
2454.43 |
457.96 |
37 |
2000 |
2140 |
2450 |
2995 |
3690 |
72 |
2570.04 |
513.11 |
38 |
2090 |
2200 |
2737.5 |
3580 |
4120 |
72 |
2846.26 |
587.45 |
39 |
1930 |
2230 |
2780 |
3660 |
3840 |
71 |
2882.54 |
590.53 |
40 |
2400 |
2580 |
3230 |
3860 |
3940 |
77 |
3253.27 |
477.65 |
41 |
2500 |
2600 |
3312.5 |
3900 |
4210 |
72 |
3308.19 |
507.44 |
Table 4. Percentiles, number of observations, the mean and standard deviation for birthweight in the function of GA
Legend: GA, gestational age; g, grams; SD, standard deviation. Nogueira R, et al., Portugal, Porto, Embryofetal Pathology Laboratory.
Percentile |
|
|
|
BPW-R |
||||
GA |
3rd |
10th |
50th |
90th |
97th |
Number |
Mean |
SD |
12 |
.21 |
.28 |
.51 |
1.22 |
1.97 |
53 |
.68 |
.47 |
13 |
.32 |
.41 |
.63 |
1.06 |
2.5 |
61 |
.76 |
.46 |
14 |
.35 |
.51 |
.94 |
1.32 |
1.38 |
68 |
.92 |
.32 |
15 |
.34 |
.53 |
1.1 |
1.92 |
2.48 |
72 |
1.19 |
.55 |
16 |
.54 |
.68 |
1.41 |
2.11 |
2.32 |
72 |
1.43 |
.52 |
17 |
.83 |
1 |
1.78 |
2.71 |
3.16 |
69 |
1.86 |
.68 |
18 |
1 |
1.37 |
2.18 |
3.04 |
3.66 |
73 |
2.25 |
.76 |
19 |
.93 |
1.47 |
2.28 |
3.06 |
3.77 |
72 |
2.28 |
.69 |
20 |
1.41 |
1.92 |
2.59 |
4 |
4.39 |
69 |
2.78 |
.81 |
21 |
1.6 |
2.13 |
2.84 |
3.99 |
4.5 |
71 |
2.95 |
.82 |
22 |
1.97 |
2.34 |
3.41 |
4.5 |
5.57 |
71 |
3.45 |
.88 |
23 |
2.12 |
2.38 |
3.36 |
4.69 |
5.21 |
72 |
3.43 |
.91 |
24 |
2.35 |
2.67 |
3.82 |
5.15 |
6.1 |
68 |
3.94 |
1 |
25 |
1.82 |
2.23 |
3.56 |
5.22 |
7 |
48 |
3.83 |
1.57 |
26 |
2.16 |
2.55 |
3.9 |
5.14 |
6.44 |
43 |
3.93 |
1.19 |
27 |
2.66 |
3.39 |
4.09 |
6.42 |
7.08 |
35 |
4.45 |
1.2 |
28 |
2.45 |
3.09 |
4.82 |
6.45 |
7.7 |
61 |
4.77 |
1.35 |
29 |
2.91 |
3.19 |
4.63 |
6.27 |
7.74 |
43 |
4.85 |
1.49 |
30 |
3.52 |
3.73 |
5.42 |
6.74 |
7.68 |
47 |
5.28 |
1.16 |
31 |
3.58 |
4.17 |
5.42 |
6.99 |
8.07 |
56 |
5.54 |
1.17 |
32 |
3.78 |
4.12 |
5.67 |
7.53 |
7.95 |
67 |
5.74 |
1.28 |
33 |
3.82 |
4.33 |
5.96 |
7.37 |
8.63 |
72 |
5.96 |
1.26 |
34 |
4.59 |
4.91 |
6.45 |
7.98 |
8.91 |
72 |
6.49 |
1.78 |
35 |
4.73 |
5.04 |
6.45 |
8.1 |
8.53 |
75 |
6.48 |
1.18 |
36 |
4.58 |
5.3 |
6.93 |
8.89 |
9.77 |
77 |
6.96 |
1.31 |
37 |
4.96 |
5.46 |
6.76 |
8.89 |
9.69 |
72 |
6.95 |
1.27 |
38 |
4.64 |
5.29 |
6.93 |
8.56 |
9.51 |
72 |
6.86 |
1.38 |
39 |
3.96 |
4.96 |
6.53 |
8.5 |
8.88 |
71 |
6.65 |
1.34 |
40 |
4.82 |
5.68 |
6.92 |
8.57 |
8.98 |
77 |
6.97 |
1.07 |
41 |
5.35 |
5.95 |
7 |
8 |
9.16 |
72 |
7.07 |
.94 |
Table 5. Percentiles, number of observations, the mean and standard deviation for birth/placental weight ratio (BPW-R) in the function of GA
Legend: GA, gestational age; SD, standard deviation. Nogueira R, et al., Portugal, Porto, Embryofetal Pathology Laboratory.
Percentile |
|
|
|
PW-R |
||||
GA |
3rd |
10th |
50th |
90th |
97th |
Number |
Mean |
SD |
12 |
.51 |
.82 |
1.96 |
3.55 |
4.84 |
53 |
2.22 |
1.77 |
13 |
.40 |
.94 |
1.59 |
2.45 |
3.10 |
61 |
1.63 |
.67 |
14 |
.72 |
.76 |
1.07 |
1.96 |
2.83 |
68 |
1.27 |
.60 |
15 |
.40 |
.52 |
.91 |
1.89 |
2.90 |
72 |
1.08 |
.72 |
16 |
.43 |
.47 |
.71 |
1.47 |
1.86 |
72 |
.84 |
.47 |
17 |
.32 |
.37 |
.56 |
1.00 |
1.20 |
69 |
.62 |
.26 |
18 |
.27 |
.33 |
.46 |
.73 |
1.00 |
73 |
.50 |
.20 |
19 |
.27 |
.33 |
.44 |
.68 |
1.07 |
72 |
.50 |
.28 |
20 |
.23 |
.25 |
.39 |
.52 |
.71 |
69 |
.40 |
.15 |
21 |
.22 |
.25 |
.35 |
.47 |
.63 |
71 |
.37 |
.10 |
22 |
.18 |
.22 |
.29 |
.43 |
.51 |
71 |
.31 |
.08 |
23 |
.19 |
.21 |
.30 |
.42 |
.47 |
72 |
.31 |
.08 |
24 |
.16 |
.19 |
.26 |
.37 |
.43 |
68 |
.27 |
.07 |
25 |
.14 |
.19 |
.28 |
.45 |
.55 |
48 |
.29 |
.10 |
26 |
.16 |
.19 |
.26 |
.39 |
.46 |
43 |
.28 |
.09 |
27 |
.14 |
.16 |
.24 |
.30 |
.38 |
35 |
.24 |
.07 |
28 |
.13 |
.16 |
.21 |
.32 |
.41 |
61 |
.23 |
.07 |
29 |
.13 |
.16 |
.22 |
.31 |
.34 |
43 |
.22 |
.06 |
30 |
.13 |
.15 |
.18 |
.27 |
.28 |
47 |
.20 |
.05 |
31 |
.12 |
.14 |
.18 |
.24 |
.28 |
56 |
.19 |
.04 |
32 |
.13 |
.13 |
.18 |
.24 |
.26 |
67 |
.19 |
.07 |
33 |
.12 |
.14 |
.17 |
.23 |
.26 |
72 |
.18 |
.05 |
34 |
.11 |
.13 |
.15 |
.20 |
.22 |
72 |
.16 |
.03 |
35 |
.12 |
.12 |
.16 |
.20 |
.21 |
75 |
.16 |
.03 |
36 |
.10 |
.11 |
.14 |
.19 |
.22 |
77 |
.15 |
.03 |
37 |
.10 |
.11 |
.15 |
.18 |
.20 |
72 |
.15 |
.03 |
38 |
.11 |
.12 |
.14 |
.19 |
.22 |
72 |
.15 |
.03 |
39 |
.11 |
.12 |
.15 |
.20 |
.25 |
71 |
.16 |
.04 |
40 |
.11 |
.12 |
.14 |
.18 |
.21 |
77 |
.15 |
.02 |
41 |
.11 |
.13 |
.14 |
.17 |
.19 |
72 |
.14 |
.02 |
Table 6. Percentiles, number of observations, mean and standard deviation for placental weight ratio (PW-R) in function of GA
Legend: GA, gestational age; SD, standard deviation. Nogueira R, et al., Portugal, Porto, Embryofetal Pathology Laboratory.
Correlations
Placental Weight (g) |
Placental Volume |
Largest Placental Diameter |
Smallest Placental Diameter |
Placental Thickness |
||
Placental Weight (g) |
Pearson Correlation |
1 |
,883** |
,826** |
,829** |
,619** |
Sig. (2-tailed) |
|
,000 |
,000 |
,000 |
,000 |
|
N |
1951 |
1944 |
1949 |
1948 |
1947 |
|
Placental Volume |
Pearson Correlation |
,883** |
1 |
,883** |
,877** |
,621** |
Sig. (2-tailed) |
,000 |
|
,000 |
,000 |
,000 |
|
N |
1944 |
1944 |
1944 |
1944 |
1944 |
|
Largest Placental Diameter |
Pearson Correlation |
,826** |
,883** |
1 |
,918** |
,396** |
Sig. (2-tailed) |
,000 |
,000 |
|
,000 |
,000 |
|
N |
1949 |
1944 |
1949 |
1948 |
1945 |
|
Smallest Placental Diameter |
Pearson Correlation |
,829** |
,877** |
,918** |
1 |
,398** |
Sig. (2-tailed) |
,000 |
,000 |
,000 |
|
,000 |
|
N |
1948 |
1944 |
1948 |
1948 |
1944 |
|
Placental Thickness |
Pearson Correlation |
,619** |
,621** |
,396** |
,398** |
1 |
Sig. (2-tailed) |
,000 |
,000 |
,000 |
,000 |
|
|
N |
1947 |
1944 |
1945 |
1944 |
1947 |
|
Table 7. Correlation between placental measures, placental weight and placental volume
**. Correlation is significant at the 0.01 level (2-tailed). Nogueira R, et al., Portugal, Porto, Embryofetal Pathology Laboratory