Comparative Economic Analysis of Natural Gas Process Route Using Genetic Algorithm Optimization Technique
Received Date: May 16, 2025 Accepted Date: June 16, 2025 Published Date: June 19, 2025
doi:10.17303/jcec.2025.4.102
Citation: Kpuduwei B.J. Funakpo, Philomena K. Igbokwe, Nwabanne T. Joseph, Matthew N. Abonyi (2025) Comparative Economic Analysis of Natural Gas Process Route Using Genetic Algorithm Optimization Technique. J Chem Eng Catal 4: 1-22
Abstract
This Paper focuses on the optimization of a chemical processing system to enhance its economic viability and operational efficiency. The primary objective was to minimize total production cost (TPC), improve product purity, and maximize profitability through the optimization of key operational parameters such as temperature, pressure, and energy consumption. Using Aspen HYSYS process simulation and genetic algorithm optimization techniques, the study identified the optimal values for these parameters, leading to significant improvements in both the financial and performance metrics of the process. The analysis revealed that the optimization process resulted in a substantial reduction in the payback period from 11 months to 9 months, an increase in the Internal Rate of Return (IRR) from 8.8% to 11.885%, and a notable improvement in Net Present Value (NPV) from 4,136,520. Additionally, product purity, specifically for NGL and LPG, saw considerable enhancement, owing to the optimization of temperature and pressure through energy recycling. The findings demonstrate that process optimization not only improves product quality but also enhances the overall economic sustainability of the system. The results underscore the potential for optimization to drive profitability and efficiency, making it a crucial strategy for improving the economic performance of chemical and industrial processes.
Keywords: Natural Gas Process Route; Genetic Algorithm; HYSYS And Aspen; Total Production Cost
Introduction
Natural gas plays a pivotal role in the global energy landscape due to its versatility, efficiency, and relatively lower environmental impact compared to other fossil fuels [1,2]. It is widely utilized across various sectors, including electricity generation, heating, industrial processes, and as a feedstock for chemical production [3-5]. As the world transitions towards cleaner energy solutions, the demand for natural gas continues to grow, necessitating efficient and sustainable methods for its processing. The significance of this process lies in its ability to enhance the quality, safety, and economic value of natural gas, making it an indispensable part of the energy industry. Raw natural gas extracted from reservoirs often contains impurities such as hydrogen sulfide (H₂S), carbon dioxide (CO₂), water vapor, and inert gases [6]. These impurities can cause safety hazards, including pipeline corrosion, equipment damage, and environmental pollution. Processing removes these harmful substances, ensuring that the gas is safe for transportation and use. The processing of natural gas involves the removal of impurities, separation of valuable components, and preparation of the gas for transportation and utilization. Key steps include dehydration, desulfurization, and the extraction of natural gas liquids (NGLs). However, these processes are complex, energy-intensive, and often require trade-offs between economic viability, environmental impact, and operational efficiency. Natural gas processing is a sophisticated series of steps designed to meet the growing demand for high-quality, safe, and environmentally friendly energy. Each technique plays a specific role in ensuring the gas is market-ready while maximizing its economic and environmental benefits. As technology advances, these techniques continue to evolve, further enhancing the efficiency and sustainability of natural gas processing. (Mingqiang et al., (2019) did a research study on the oil and gas recovery of Middle East sours crude oil imported from China using the condensing recovery method. The process of recovery process was simulated by Aspen HYSYS, and the condensing recovery process was optimized. The results showed that the condensation temperature has the greatest influence on the recovery of oil and gas components in the oil and gas recovery process, and the three-stage condensing process is used in the condensation process. The recovery rate of oil and gas increases to more than 84% at the temperature of 2 °C, -50 °C, -130 °C (Mingqiang et al., 2019). Several authors have worked on the most efficient, cost-effective optimization process, economic viability of producing synthetic diesel from natural gas, economic evaluation of four major gas utilization options, comparative economic analysis of the production of diesel through Gas-to-Liquid (GTL) Technology and the production of Liquefied Natural Gas (LNG) both using natural gas, and comparative economic investigation options for Liquefied Petroleum Gas plant, which processes feed from natural gas wells and dehydrating units to produce Liquefied Petroleum Gas along with natural gasoline having a higher value as separate product [7-11]. In recent years, optimization techniques such as Aspen HYSYS and ProMax, Artificial Neural Networks (ANNs), etc., have been increasingly applied to improve the efficiency and effectiveness of natural gas processing routes. Among these techniques, genetic algorithms (GAs) have emerged as a powerful tool for solving complex optimization problems. GAs is inspired by the principles of natural selection and evolution, enabling them to efficiently search for optimal or near-optimal solutions in large and complex solution spaces. Despite the advantages of using genetic algorithms in optimization, a comprehensive comparison of various natural gas processing routes using this technique has been relatively limited in academic and industrial studies. Such a comparative analysis is crucial for identifying the most effective processes in terms of cost, energy efficiency, and environmental impact, particularly in a world increasingly focused on sustainable energy practices. This study aims to bridge this gap by leveraging genetic algorithm optimization techniques to analyze and compare multiple natural gas processing routes. By doing so, it seeks to provide valuable insights into the strengths and limitations of different approaches, contributing to the development of more efficient and sustainable natural gas processing methods. Optimization in natural gas processing is a vital strategy for improving process performance, reducing operational costs, and achieving sustainability goals. By leveraging advanced techniques like genetic algorithms and artificial intelligence, the industry can address current challenges and position itself for a sustainable future. The main essence of this study will be to determine the most optimized economic process that would generate low impurity with high profitability analysis on the products of the natural gas. The products of interest from the natural gas processed in this study includes; the natural gas liquid (NGL), lean gas and the liquefied petroleum gas (LPG).
Materials and Methods
Materials Used
Data Acquisition
The information required which will be the Cottonwooden natural gas process route will be obtained from a gas processing industry located in Omasi, Anambra state, South-East Nigeria. The data obtained includes the information of the feed stream (which was the natural gas), the process routes of the Cottonwooden gas limited, will be obtained including the materials and energy material flows and the existing product purity levels. The data from the Cottonwooden natural gas processing data obtained will be deployed in the generation of the process flow diagram (PFD) of the process, the sequential modeling and the optimization of the process to determining the process equipment utilized for the determination of solution for economic analysis improvement and increase in process product impurity. The information utilized as input parameter to the process design of the three processes is shown in Table 3.2 and Table 3.3.
Feed gas will be obtained from Wellhead. Daily separation of natural gasoline and LPG from this 5mmscfd natural gas recovery system, then the treated natural gas (after separation of natural gasoline and LPG) will be pressurized to 25 MPa compressed natural gas, CNG. The plant consists of process equipment and ancillary auxiliary engineering and utility installations. Design running time of 8000 hours with operating flexibility of 60% to 110%. This device mainly includes four main parts: feed gas compressor, dryer system, light hydrocarbon recovery system and CNG compressor. The Cottonwooden gas process route (Process Flow Diagram) is shown in figure 3.2
The feed gas will go through a dryer system cooled to -35℃ by plate heat exchanger first (E-201), then throttle to 2.1MPaA by the valve (HCV-20101)and enter into the bottom of absorber (T-201). In absorber (T-201) the gas makes full contact with the liquid from the top of the de-ethane tower (T - 202). The cold lean gas from the top of absorber (T-201) recover the cold energy by plate heat exchanger one (E-201), then enter into CNG compression system. The liquid from the bottom of absorber (T-201) boost by absorption tower bottom booster pump (P-202) and enter the top of de-ethane tower (T-202) after heat by plate heat exchanger two (E-202). The gas from the top of de-ethane tower (T-202) cool by plate heat exchanger two (E-202) enter into the top of absorber (T-201). The gas will depressurize and the temperature will get lower and let the recovery rate of light hydrocarbon higher. The Light Hydrocarbon Recovery System is shown in figure 3.3.
Methods
The research will be carried out in several steps. The flow diagram showing the research procedure is shown in the flow diagram in Figure 3.1. The procedures for the investigation are described as follows;
Modeling of the process using the design application software (HYSYS) to obtain the purity of the LPG, lean gas, and NGL products. The parameters considered in the modeling of the process include: maximization of the products purity and minimize the emission of toxic gases such as Hydrogen Sulphide, H2S and Carbon (IV) oxide, CO2, minimization in the production cost, maximization in profitability analysis and maximization of product purity.
The sequential models will be deployed to monitor the pressure, temperature and material flow to obtain area with issues (low pressure, temperature and inadequate material) flow so as to determine the adequate measures that would be utilized for improvement.
An optimization (Genetic Algorithm) process will be used to optimize the parameters of the proposed process equipment and increases the purity level of the NGL and LPG products and improve on the economic analysis of the Cottonwooden gas limited process routes because the existing problems includes low LPG, lean gas and NGL purity and high production cost and low profit analysis).
Process Basic Modeling
The natural gas process for the production of LPG, NGL and Lean gas is largely a gaseous process hence, the basic model theory suggests the peng robinson model theory with vander-waals weak gas force shown in equation 3.1.
Where P represents the pressure (bar), V represents the volume of the stream (m3); T represents the temperature of the stream (oC) and R represents the general gas coefficients. The b represents;
Where Tc represents the critical temperature, Pc represents the critical pressure, Tr and Pr represents the reduced temperature and pressure of the process, a,b,c, α represents the coefficient of the van der waals state equation, w represents the acentric factor of the process.
The Peng Robinson will be the primary and basic model utilized for the gas process simulation in HYSYS and the essence is because it is the best state equation for gas steady state simulation.
Hence for the material flow, the basic model was shown in equation 3.7.
Where F represents the molar flow process.
Hence, irrespective of the process equipment that was modeled, the amount of process stream in will be equal to the stream out which implies absence of accumulation. The same principle will be deployed for the energy balance of the process.
The sequential modeling for the fractionation train representing the LPG, NGL and lean gas recovery process was shown in Figure 3.3.
Process parameter Comparative analysis and optimization.
The amount of the production cost for each of the process was determined, together with the profit made, the level of purity achieved from the three products (NGL, LPG, and lean gas) and the amount of toxic gas emitted. The performance of the parameters for each of the process were determined and presented in the result chapter. The optimization of the process parameters was done for each of the process routes described. The genetic algorithm optimization technique was utilized and the objective function formed for the optimization process was shown in equation 3.8.
Where x1, x2, x3, and x4 represents profits, purity level, toxic emission and production cost and a0 to a4 represents the coefficients of the processing parameters. The processes with the best optimized parameters was determined and presented in the result section. The flow chart for the optimization modeling and simulation was shown in Figure 3.5. The outcome of figure 3.4 would determine the process adjustments to improve the purity and economic analysis of the process.
The aim of the optimization carried out was to reduce the production cost, increase the profit and increase the product purity. The parameters utilized for the optimization achievement was the pressure and temperature of the process and the process units considered for the De-ethanizer (Lean Gas recovery tower) and the De-butanizer. With the values achieved from the process simulation, the model for purity improvement, cost reduction and profit increase for the De-ethanizer was shown in equation 3.9.
Where TPC was the total production cost, P represents profit, PP represents product purity, t represents the Temperature and Pr represents the pressure. The model for purity improvement, cost reduction and profit increase for the De-butanizer was shown in equation 3.10.
On subjecting the models to the linear search optimization method, the plots of the temperature optimization progress for the De-ethanizer was achieved. The model in figure 3.6, showed the simulation of the optimized system.
Material Balance around the slug catcher
From the results illustrated in Figure 4.1, a natural gas stream with a flow rate of 130,000 kmol/hr was fed into the slug catcher for initial processing. The slug catcher, a critical component in natural gas processing, is designed to separate gas and liquid phases, ensuring the efficient removal of liquids and particulates before the gas continues downstream. Upon processing, the slug catcher directed a gas stream of 129,500 kmol/hr to the compressor for further pressurization. Concurrently, the natural gas liquids (NGL) recovered from the slug catcher amounted to 500 kmol/hr. These NGLs were subsequently mixed into the final product stream, contributing to the value-added by-products of the process. Notably, the liquid waste from the slug catcher was recorded as 0 kmol/hr. This outcome is attributed to the feed entering the unit predominantly in the gaseous phase, with minimal or no entrained liquid present in the incoming stream. The absence of liquid waste highlights the efficiency of the upstream phase separation and the effectiveness of the slug catcher in handling the feed conditions. This balance underscores the importance of maintaining optimal operating conditions in the slug catcher to maximize gas recovery, ensure the seamless removal of liquids, and minimize waste, all of which contribute to the overall efficiency of the natural gas processing system.
Material Balance of the de-ethanizer
The material balance of the de-ethanizer, as presented in Figure 4.2, provides valuable insights into the distribution of the various components in the process. From the analysis of the data in Figure 4.4, it is evident that the amount of lean gas (LG) sent for purification was significantly larger than the amount directed to the debutanizer. This outcome can be attributed to the higher concentrations of methane (C1) and ethane (C2) present in the feed stream. These two components are the primary constituents of the lean gas, and their high concentration necessitates a larger volume of LG for further treatment. The lean gas (LG) was then subjected to purification in a flash column, a critical unit operation designed to enhance the purity of the gas. Flash distillation in the column allows for the separation of components based on differences in boiling points. By operating at a controlled pressure and temperature, the flash column effectively removes heavier hydrocarbons and other impurities, resulting in a purified lean gas stream. This purification process is essential for improving the quality of the LG, ensuring that it meets the desired specifications for its intended use, such as in CNG production or other commercial applications. The use of the flash column in the purification step highlights the importance of efficient separation techniques in natural gas processing. By selectively separating lighter components, such as methane and ethane, from heavier hydrocarbons, the process ensures that the final product is of the highest possible purity. The result is a lean gas stream that is suitable for use in applications that demand high-quality fuel or feedstock, while also minimizing the amount of undesirable by-products that might otherwise be present in the final product.
Material balance around the LG purification column
From the bar chart presented in Figure 4.3, it is observed that the inlet to the lean gas (LG) purifier was 115,700 kmol/hr. The process flow then branches into two primary outputs: the purified lean gas (LG) and the waste stream. The purified LG had a flow rate of 115,690 kmol/hr, while the waste stream consisted of 10 kmol/hr. This data suggests that a substantial portion of the feed stream is effectively purified and retained as high-quality lean gas, while a small fraction is removed as waste. At first glance, it could be argued that the flashing system, which is employed in the LG purifier, might be considered unnecessary due to the relatively small amount of waste being produced (10 kmol/hr). However, the use of the flashing system becomes vital due to its specific role in purifying the LG stream, particularly by removing impurities like hydrogen sulfide (H₂S) and carbon dioxide (CO₂). These two components are particularly detrimental to the quality of the lean gas and need to be removed to meet safety, environmental, and commercial standards. The flashing system, while seemingly contributing to a minimal waste stream, plays a crucial role in removing up to 80,000 kmol per year of H₂S and CO₂ from the lean gas. This purification is necessary because the presence of these impurities in natural gas can lead to issues such as corrosion in pipelines, reduced efficiency in downstream processes, and non-compliance with regulatory standards for natural gas quality. Furthermore, hydrogen sulfide is highly toxic and poses significant health and environmental risks, making its removal an essential step in the processing of natural gas. The necessity of the flashing system lies in its ability to remove these impurities efficiently, even though the waste stream may appear small in comparison to the total amount processed. The system's ability to significantly improve the quality of the lean gas makes it an indispensable part of the purification process, ensuring that the final product meets the required specifications for commercial use, transportation, and storage. By doing so, the flashing system helps to optimize the entire natural gas processing operation, ensuring both the safety and economic viability of the process.
Material Balance around the De-butanizer
From the results presented in Figure 4.4, it is evident that the propane gas (PG) stream, which represents the top product of the de-butanizer, had a higher flow rate than the natural gas liquids (NGL) stream. This can be attributed to the composition of the feed stream, which contained significant amounts of propane (C3), isobutane (i-C4), and normal butane (n-C4). These components, being lighter hydrocarbons, primarily contribute to the production of propane gas, and their higher concentrations in the feed stream naturally result in a larger output of PG from the de-butanizer. Specifically, the propane gas (PG) stream had a flow rate of 10,000 kmol/hr, significantly higher than the NGL stream, which had a flow rate of 4,274 kmol/hr. The higher flow rate of PG reflects the separation of propane from other heavier hydrocarbons such as butanes and heavier liquids in the de-butanizer column. Propane, being one of the most valuable components in the NGL fraction, is separated and purified for use in various industrial and domestic applications, including liquefied petroleum gas (LPG). The propane gas was subsequently compressed to generate LPG, which is then stored for future use. LPG, derived from propane, is an important fuel source in both domestic and industrial sectors due to its versatility, high energy content, and ease of transportation. The compression process allows for the liquefaction of propane, increasing its density for easier storage and handling. Once liquefied, LPG can be transported in bulk for use as a cooking fuel, refrigerant, or even as an alternative to gasoline in vehicles. On the other hand, the NGL stream, which consists of a mixture of lighter hydrocarbons, was blended with the NGL recovered from the slug catcher. This blended NGL stream was then stored for future use or further processing. The combination of NGL from the de-butanizer and the slug catcher ensures that a consistent, high-quality NGL product is available, which can be further processed or sold depending on market conditions. These NGLs can be separated into their individual components—ethane, propane, butanes, and other liquid hydrocarbons—depending on their specific applications, including use in petrochemical production, gasoline blending, or other industrial uses. The separation and subsequent compression of propane to produce LPG, along with the blending of the NGL stream, illustrate the versatility and efficiency of the de-butanizer process in the natural gas processing system. By effectively separating and recovering valuable products like PG and NGL, the process contributes to maximizing the economic value of the natural gas stream while minimizing waste.
Energy Balance of the Process System
Table 4.1 provides a detailed breakdown of the energy dynamics during the process, revealing that the total energy required for its operation was 75,174,000 kJ/hr. In contrast, the total energy released during the process was recorded as 230,918,900 kJ/hr. The discrepancy between the energy input and output indicates an energy loss of 155,744,900 kJ/hr, which is both substantial and concerning. Such a high level of energy loss highlights inefficiencies within the system, representing an opportunity for significant improvement. This excessive energy loss was identified as a critical factor necessitating the implementation of an optimization process. The optimization aimed to address these inefficiencies by refining system performance, ensuring more efficient energy use, and improving overall process outcomes. Specifically, the optimization process was designed to enhance the purity of the final product, which is essential for meeting quality standards and customer expectations. Furthermore, the improvements were targeted at increasing profitability by reducing unnecessary energy expenditures, lowering operational costs, and ultimately enhancing the economic viability of the process. The integration of these measures demonstrates a strategic approach to achieving sustainable and cost-effective production.
Economic Analysis of the System before Optimization
The material stream cost, energy stream cost, direct cost, indirect cost, management cost, and plant installation cost are illustrated in Figure 4.6. Analysis of the system processing costs presented in the figure revealed that the cost of purchasing and generating the energy required for the process exceeded all other cost parameters associated with natural gas processing. This finding underscores the necessity of implementing an optimization process to reduce energy costs while achieving high product purity. Figure 4.7 highlights the total production cost and profit generated. The economic analysis indicates that the production cost amounted to $6,676,730, while the profit achieved was $7,344,400. This reflects a profit exceeding the total production cost by 10%. However, when considering the plant's annual operation of 8,000 hours, the profit margin was deemed modest. Consequently, system optimization became imperative to enhance component purity, lower production costs, and improve profit margins. These adjustments aim to ensure more efficient operations and greater economic viability over the long term
Impact of the optimization on Temperature and pressure in de-ethanizer
Figure 4.8 provides a detailed analysis of the temperature progression results, highlighting that the optimal temperature for the process was determined to be 64°C. This specific temperature represents the point at which the process achieved maximum product purity, minimal total production cost (TPC), and the highest profit margins. The significance of this optimal temperature lies in its ability to balance the thermal requirements of the process, ensuring efficient energy use and enhancing the overall performance of the system. This temperature was identified as the critical operating condition for achieving the desired process outcomes, as evidenced by the optimal point displayed in Figure 4.8 (a). In a similar manner, Figure 4.8 (b) presents the pressure progression results, revealing that the optimal pressure for the process was 83 kPa. This pressure value represents the ideal operating condition for achieving the same objectives of maximum product purity, reduced TPC, and enhanced profitability. The optimal pressure ensures that the system operates within a range that minimizes energy losses and maximizes efficiency, contributing to the economic and technical feasibility of the process. As shown in Figure 4.8 (b), the identified optimal pressure corresponds to the point where these desired outcomes were achieved, further emphasizing the importance of maintaining precise control over process conditions. Together, these findings underscore the critical role of temperature and pressure optimization in achieving efficient and cost-effective operations.
Impact of the optimization on inlet Temperature and pressure in NGL De-butanizer
Figure 4.9 (a) illustrates that the optimal operating temperature for the De-butanizer was determined to be 89.6°C. This inlet temperature represents a critical point in the process, as it resulted in achieving the highest possible product purity, the lowest total production cost (TPC), and the maximum profit. The significance of this temperature lies in its ability to balance the thermal energy requirements of the De-butanizer, ensuring efficient separation while minimizing energy consumption and operational costs. By operating at this optimal temperature, the process was able to achieve enhanced performance and economic efficiency, as shown in Figure 4.5. In addition to temperature optimization, the progress of optimizing the operational pressure for the distillation column is also presented in Figure 4.9 (b). This optimization aimed to further enhance product purity, reduce TPC, and maximize profitability. From Figure 4.9 (b), the analysis shows that the optimal pressure for the De-butanizer was 83 kPa. Operating at this pressure ensured that the system achieved the desired separation efficiency, minimized energy losses, and maintained stable operating conditions. The combination of these optimal temperature and pressure values was critical for ensuring that the De-butanizer operated at peak efficiency, ultimately leading to improved product quality, reduced costs, and higher profitability. These findings highlight the importance of precise control and optimization of both temperature and pressure parameters in achieving sustainable and cost-effective operations.
Impact of optimized parameters on Total Production cost (TPC)
The comparative analysis of the actual, optimization-calculated, and optimization-implemented TPC is presented in Figure 4.10. Three key terms were used to evaluate the outcome of the optimized parameter: actual parameter, calculated parameter, and implemented parameter. The actual parameter represents the initial value before the optimization process. The calculated optimal parameter is derived from computational optimization using Equations 3.9 and 3.10. Meanwhile, the implemented optimal parameter refers to the optimized value obtained after applying the optimization process in the process flow diagram in HYSYS. As shown in Figure 4.5, the actual TPC was $50,749,050, while the calculated optimal TPC was $38,043,000, and the implemented optimal TPC was $39,927,800. Both optimized TPC values (calculated and implemented) were lower than the actual TPC, primarily due to energy reduction measures implemented in the process.
Impact of the optimized parameters on Revenue
As illustrated in Figure 4.11, the analysis revealed that the actual revenue generated from the process was $60,074,000. In contrast, the optimal revenue, obtained through computational optimization, was $75,093,000, while the implemented optimal revenue, achieved after applying the optimization process in the process flow diagram in HYSYS, was $72,817,000. Both the calculated and implemented optimal revenues were significantly higher than the actual revenue. This increase can be attributed to the enhanced efficiency of the process, particularly the improvement in the purity of the final products. Higher product purity often leads to greater market value and demand, thereby contributing to increased revenue. The optimization process likely reduced impurities and improved separation efficiency, ensuring that the final products met higher quality standards. As a result, the refined product composition commanded a higher price, ultimately boosting overall revenue.
Impact of optimized parameters on NGL Purity
As depicted in Figure 4.12, the analysis demonstrated that the actual purity of Natural Gas Liquids (NGL) obtained from the process was 82.21%. In comparison, the optimal NGL purity, determined through computational optimization, was 99.81%, while the implemented optimal NGL purity, achieved after applying the optimization process in the process flow diagram in HYSYS, was 99.57%. Both the calculated and implemented optimal NGL purity levels were significantly higher than the actual purity, indicating a substantial improvement in product quality. This outcome can be attributed to the optimization of key process parameters, particularly temperature and pressure, which were adjusted to enhance the separation efficiency. Additionally, the optimization process incorporated energy recycling strategies, which contributed to maintaining optimal operational conditions, minimizing energy losses, and improving the overall separation process. By achieving these optimized conditions, the removal of impurities was more effective, leading to a higher concentration of NGL in the final product. This increase in purity not only enhances the economic value of the product but also ensures compliance with industry standards for high-purity NGL, making it more suitable for downstream applications such as petrochemical processing and fuel production.
Impact of Optimization on LPG purity
As illustrated in Figure 4.8, the analysis revealed that the actual purity of Liquefied Petroleum Gas (LPG) obtained from the process was 82.27%. In contrast, the optimal LPG purity, determined through computational optimization, was 99.16%, while the implemented optimal LPG purity, achieved after applying the optimization process in the process flow diagram in HYSYS, was 99.08%. Both the calculated and implemented optimal LPG purity levels were significantly higher than the actual purity, indicating a substantial improvement in the quality of the final product. This enhancement can be attributed to the optimization of key process parameters, particularly temperature and pressure, which were adjusted to achieve more efficient separation. The optimization process also incorporated energy recycling strategies, ensuring that the process operated under optimal thermal and pressure conditions while minimizing energy losses. By achieving these optimized conditions, the separation of LPG from other components in the mixture was more effective, leading to a higher concentration of LPG in the final output. This increase in purity enhances the product’s market value and ensures compliance with industry standards for high-purity LPG, making it more suitable for applications such as domestic and industrial fuel use, chemical feedstocks, and other downstream processing.
Impact of optimized parameters on Payback period
Figure 4.9 provides a detailed comparative analysis of the payback periods across three scenarios: the actual, optimally calculated, and optimally implemented payback periods. The actual payback period for the process was found to be 0.91 years, or approximately 11 months. This represents the period it would take for the initial investment to be recovered under the current operational conditions without any process optimization. In contrast, the payback period for the calculated optimization of the process was 0.73 years, or 9 months. This calculation was based on optimization methods that considered the most efficient operational parameters, such as energy usage, temperature, and pressure. The calculated payback period was notably shorter than the actual payback period, demonstrating the potential for enhanced financial performance through optimization. The optimally implemented payback period, which represents the actual payback period achieved after implementing the optimization measures in the process, was determined to be 0.75 years, or 9 months. This figure is very close to the calculated optimization value, further confirming that the optimization process was successful in achieving the desired outcome. A shorter payback period is an important indicator of the economic value of the process. It signifies that the initial investment in the system will be recovered more quickly, thus improving the overall financial feasibility of the project. In this case, the optimization process effectively reduced the payback period from the initial 11 months to 9 months, making the optimized process more economically attractive. This improvement not only reflects enhanced efficiency but also highlights the importance of optimization in improving the return on investment and making the process more economically viable in the long term.
Impact of optimized parameters on internal rate of return (IRR)
Figure 4.10 provides a detailed comparative analysis of the actual, optimally calculated, and optimally implemented Internal Rate of Return (IRR) for the process. The actual IRR, which reflects the rate of return under the current operating conditions without any optimization, was found to be 8.8%. This figure represents the return on investment based on the existing process parameters and cost structure. However, after implementing process optimization, the calculated IRR increased significantly to 16%. This improvement was achieved through the optimization of various process parameters, such as energy usage, temperature, and pressure, which enhanced overall efficiency and reduced operational costs. The calculated IRR, therefore, demonstrates the potential for improved financial performance when the process is optimized. The optimally implemented IRR, which represents the rate of return achieved after actually implementing the optimization measures, was determined to be 11.885%. While this value is slightly lower than the calculated IRR, it still reflects a significant improvement over the actual IRR of 8.8%. This increase in IRR shows that the optimization process led to a more economically viable operation, with better returns on investment. Since a higher IRR indicates greater economic value and profitability for the process, the successful increase in IRR from 8.8% to 11.885% highlights the effectiveness of the optimization efforts. The optimization process not only improved operational efficiency but also significantly enhanced the financial feasibility of the process, making it more attractive from an investment perspective. Ultimately, this increase in IRR demonstrates that the process optimization added substantial economic value, making the operation more profitable in the long term.
Impact of Optimized parameters on Net Present Value (NPV)
Figure 4.11 provides a detailed comparative analysis of the actual, optimally calculated, and optimally implemented Net Present Value (NPV) for the process. Initially, the actual NPV was $2,000,580, reflecting the economic value of the process before optimization. Following the calculated process optimization, the NPV increased substantially to $6,304,140, demonstrating a significant improvement in the financial performance of the system based on optimization computations. However, the optimally implemented NPV, derived from actual implementation of the optimized parameters, was $4,136,520. A higher NPV indicates that the process is more economically viable, as it reflects greater profitability over time, considering the time value of money. In this case, the optimization process effectively increased the NPV from the initial $2,000,580 to $4,136,520, a notable improvement that underscores the added economic value created by the process optimization. This increase in NPV signifies the enhanced financial performance, efficiency, and profitability of the process after optimization was implemented. Moreover, the improvements in other key financial metrics, such as the Payback Period (PP) and Internal Rate of Return (IRR), further confirm that the optimization efforts substantially contributed to the economic viability of the process. The reduced payback period and increased IRR reflect a faster return on investment and higher financial returns, respectively, making the optimized process not only economically sustainable but also more profitable in the long term
Conclusion
The optimization process conducted throughout this study has proven to significantly enhance the economic performance, efficiency, and sustainability of the system. By focusing on key parameters such as temperature, pressure, and energy usage, we successfully identified optimal operating conditions that led to improvements in product purity, total production cost (TPC), and profit generation. The results of the optimization demonstrated a reduction in the payback period, an increase in Net Present Value (NPV), and a higher Internal Rate of Return (IRR), all of which point to a more economically viable process. The comparative analyses of the actual, calculated, and implemented values of TPC, NGL, LPG purity, and other financial metrics reveal that the process optimization not only improved operational efficiency but also brought about substantial financial benefits. Specifically, the optimization reduced energy costs, improved product quality, and ultimately increased profitability by optimizing temperature and pressure parameters, as well as implementing effective energy recycling strategies. The outcomes of this study emphasize the importance of process optimization in industrial operations. The substantial improvements in key financial and performance indicators highlight how systematic adjustments can drive both operational efficiency and economic success. Future applications of these optimized parameters can lead to sustained profitability, reduced production costs, and enhanced product quality, making the optimized system an attractive investment for the long term. Therefore, this research not only contributes to enhancing the economic viability of the specific process but also offers valuable insights that can be applied to similar industrial systems for greater operational and financial performance.
- Hassan Q, Viktor P, Al-Musawi TJ, Ali BM, Algburi S, Alzoubi HM, et al. (2024) The renewable energy role in the global energy Transformations. Renewable Energy Focus, 48: 100545.
- Funakpo BJ, Philomena KI, Joseph TN, Matthew NA (2025) Modeling, Simulation and Analysis of Natural Gas Processing Routes Using HYSYS Design Applications. UNIZIK Journal of Engineering and Applied Sciences,4: 2011-23.
- Faramawy S, Zaki T, Sakr AE. (2016) Natural gas origin, composition, and processing: A review. Journal of Natural Gas Science and Engineering, 34: 34-54.
- Kapsalyamova Z, Paltsev S (2020) Use of natural gas and oil as a source of feedstocks. Energy Economics, 92: 104984.
- Worrell E, Phylipsen D, Einstein D, Martin N (2000) Energy use and energy intensity of the US chemical industry.
- Reders K, Schmidt M, Schütze A (2021) Natural Gas. Handbook of Fuels: Energy Sources for Transportation, 119-59.
- Okologume CW, Rotimi O (2022) Comparative Analysis of Utilization options for Stranded Natural Gas in Nigeria. FUPRE Journal of Scientific & Industrial Research, 6.
- Okologume W (2022) Gas-To-Plant Installation Analysis Using Well Performance Data. FUPRE Journal of Scientific and Industrial Research (FJSIR), 6: 131-47.
- Anyadiegwu C.I.C, M.C (2014) Comparative Economic Analysis of Using Natural Gas For Liquefied Natural Gas Production and Converting Natural Gas To Diesel Through Gas-To-Liquid Technology In Nigeria. International Journal of Research in Engineering and Science (IJRES), p09-26.
- Raheem A H (2021) Comparative Economic Investigation Options for Liquefied Petroleum Gas Production from Natural Gas Liquids. American Journal of Chemical Engineering, 55-69.
- HongFang, Lu, G.M (2019) Optimization of light hydrocarbon recovery system in condensate gas field. Ruston, USA: Energy Reports.
FIGURE 1
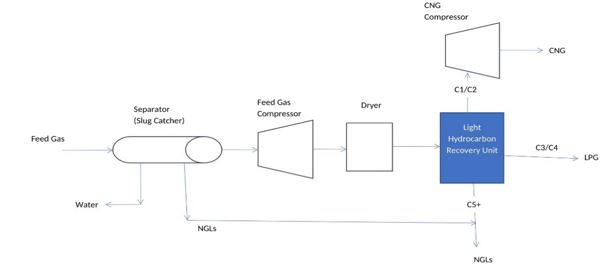
Figure 3.2: Cottonwooden gas process route (Process Flow Diagram)
FIGURE 2
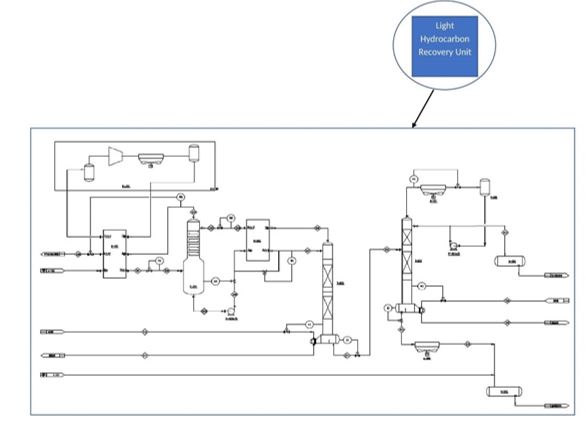
Figure 3.3: Cottonwooden gas Light Hydrocarbon recovery system
FIGURE 3
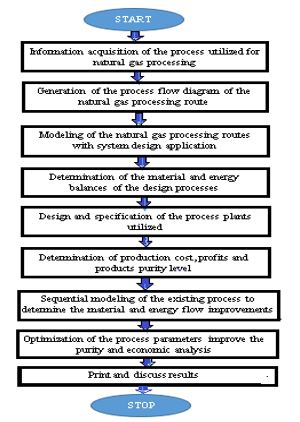
Figure 3.1: Flow diagram of the research procedure
FIGURE 4
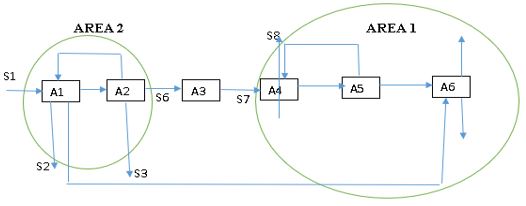
Figure 3.4: Sequential Modeling
From the sequential model presented in Figure 3.3, it will be sectionalized into two areas which represented the process recovering areas. Area 1 has the fractionation train where the NGL, LPG and the lean gases will be purified but with a purity level (Cottonwooden gas limited data). The Area 1 increased the purity but with low percent. Hence, an optimization will be carried out to determine the best route and process equipment to add or subtract to improve the purity level of the products to improve the economic analysis.
FIGURE 5
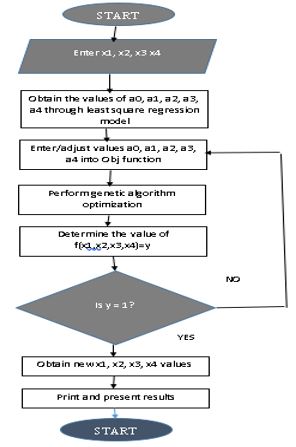
Figure 3.5: Flow chart of the genetic algorithm optimization procedure
FIGURE 6
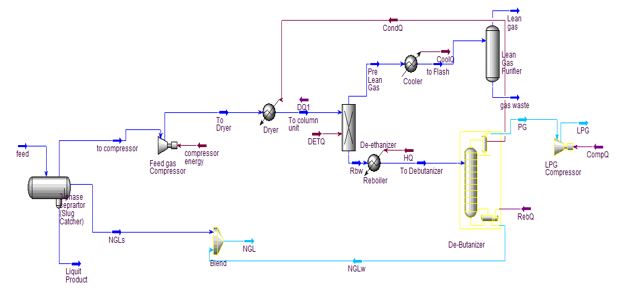
Figure 3.6: Simulation of the optimized system
FIGURE 7
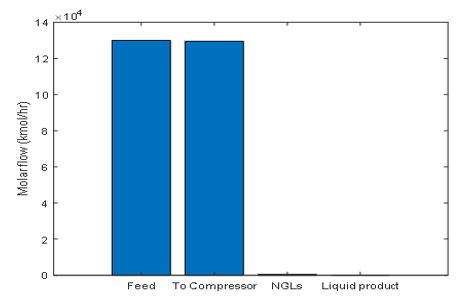
Figure 4.1: Material Balance around the slug catcher
FIGURE 8
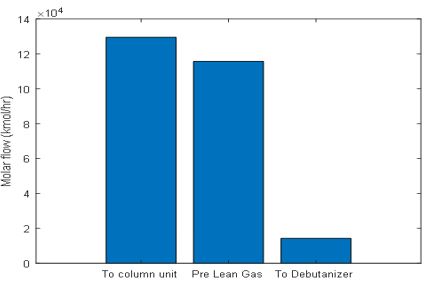
Figure 4.2: Material balance to the De-ethanizer
FIGURE 9
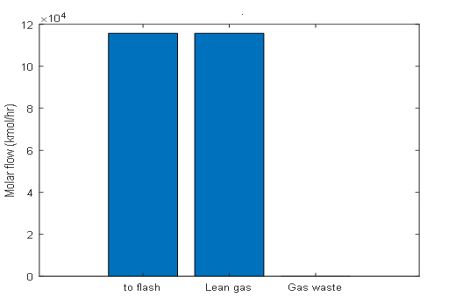
Figure 4.3: Material balance around the LG purification column
FIGURE 10
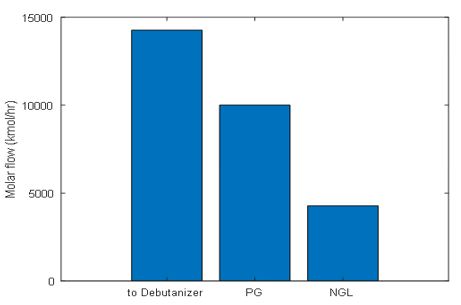
Figure 4.4: balance around the De-butanizer
FIGURE 11
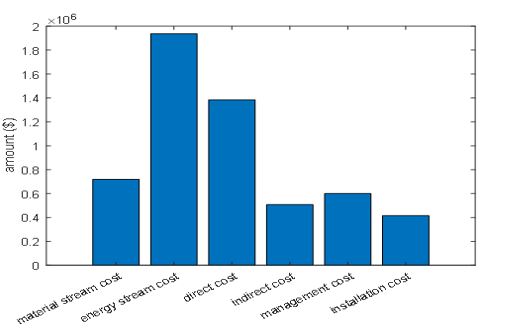
Figure 4.6: Product activities cost of the Natural gas processing system
FIGURE 12
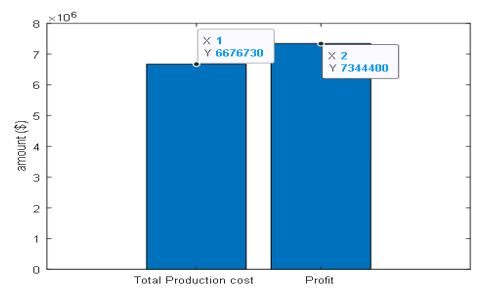
Figure 4.7: Total Production cost (TPC) and Profit achieved
FIGURE 13
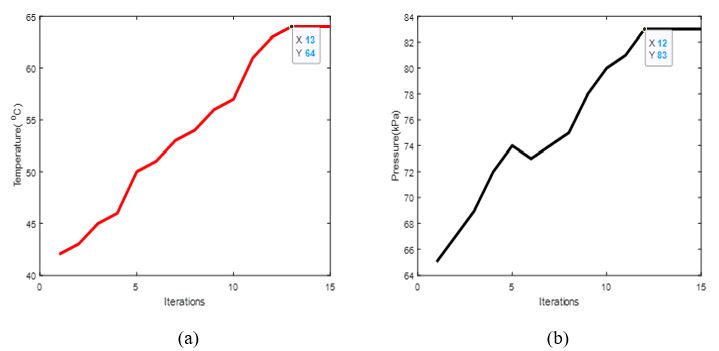
Figure 4.8: De-ethanizer (a) Temperature and (b) pressure progress during optimization
FIGURE 14
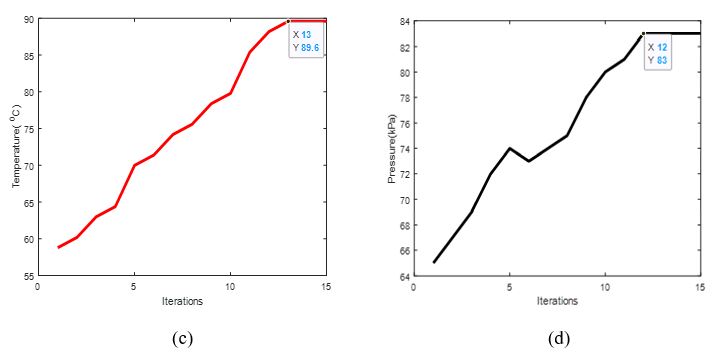
Figure 4.9: Optimized De-butanizer inlet (c) temperature (d) Pressure
FIGURE 15
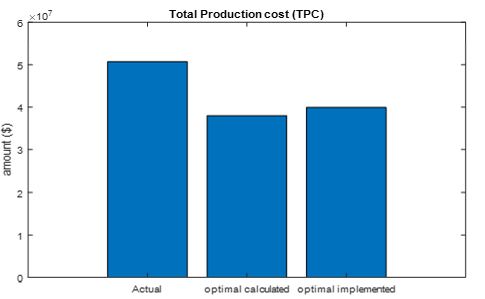
Figure 4.10: Optimal TPC
FIGURE 16
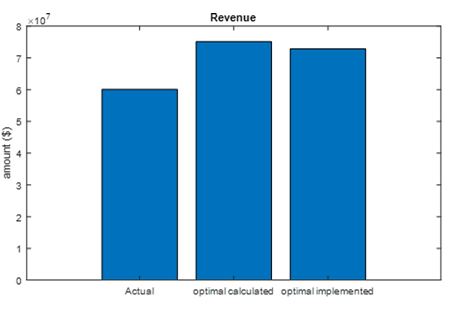
Figure 4.11: Optimal Revenue
FIGURE 17
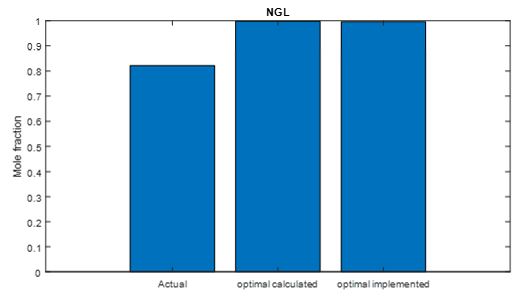
Figure 4.7: Optimal NGL
FIGURE 18
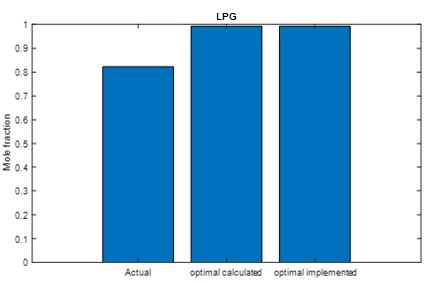
Figure 4.8: Optimal LPG purity
FIGURE 19
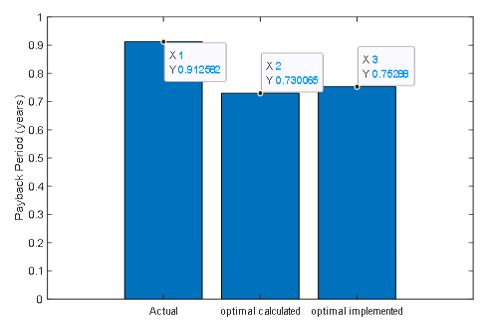
Figure 4.9: Analysis of Payback Period
FIGURE 20
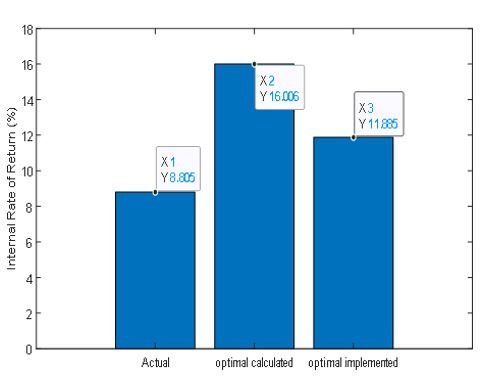
Figure 4.10: IRR comparative analysis
FIGURE 21
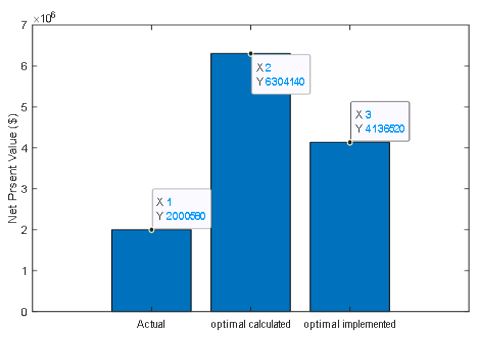
Figure 4.11: NPV comparative analysis
Tables at a glance
Figures at a glance