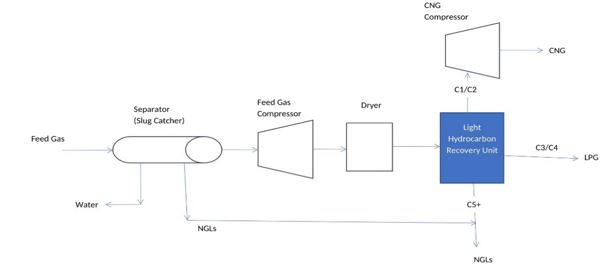
Figure 3.2: Cottonwooden gas process route (Process Flow Diagram)
Figure 3.2: Cottonwooden gas process route (Process Flow Diagram)
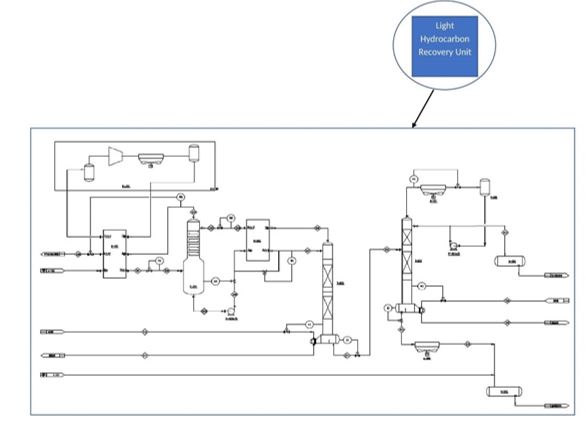
Figure 3.3: Cottonwooden gas Light Hydrocarbon recovery system
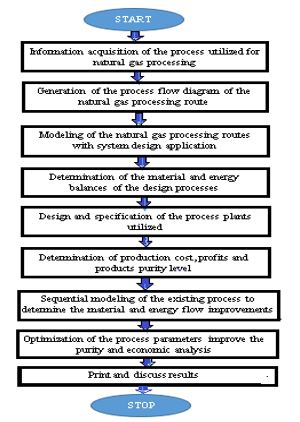
Figure 3.1: Flow diagram of the research procedure
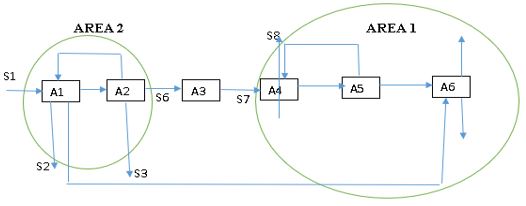
Figure 3.4: Sequential Modeling
From the sequential model presented in Figure 3.3, it will be sectionalized into two areas which represented the process recovering areas. Area 1 has the fractionation train where the NGL, LPG and the lean gases will be purified but with a purity level (Cottonwooden gas limited data). The Area 1 increased the purity but with low percent. Hence, an optimization will be carried out to determine the best route and process equipment to add or subtract to improve the purity level of the products to improve the economic analysis.
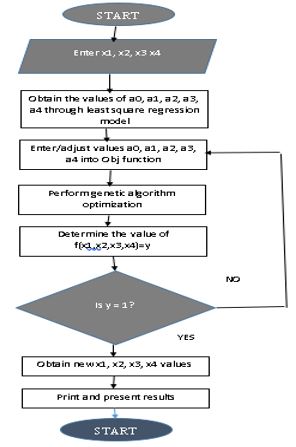
Figure 3.5: Flow chart of the genetic algorithm optimization procedure
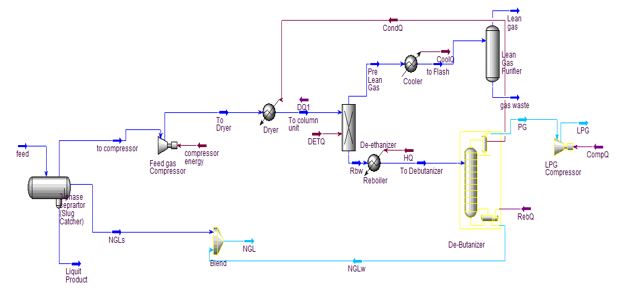
Figure 3.6: Simulation of the optimized system
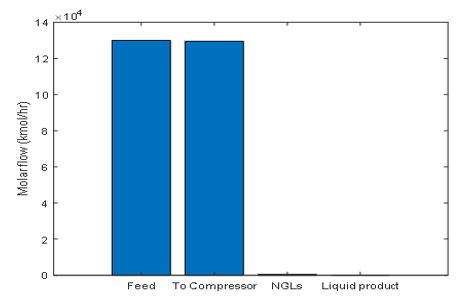
Figure 4.1: Material Balance around the slug catcher
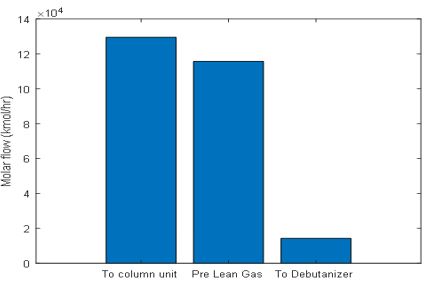
Figure 4.2: Material balance to the De-ethanizer
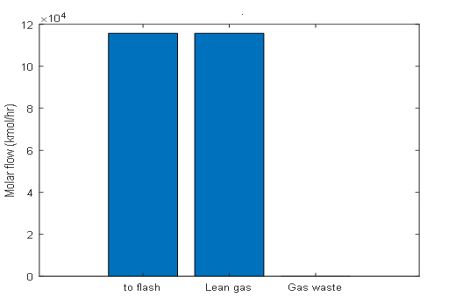
Figure 4.3: Material balance around the LG purification column
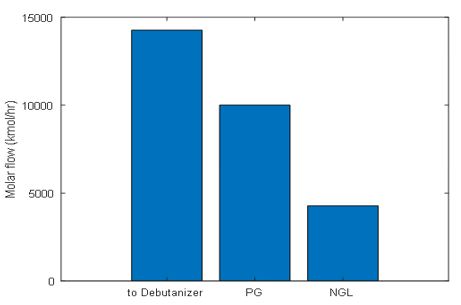
Figure 4.4: balance around the De-butanizer
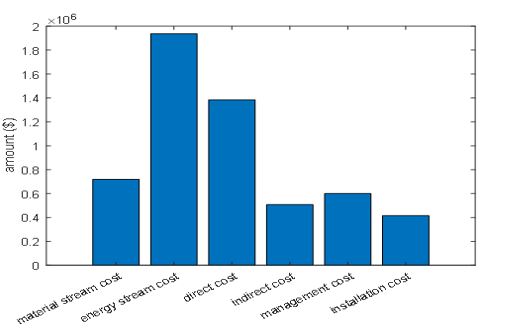
Figure 4.6: Product activities cost of the Natural gas processing system
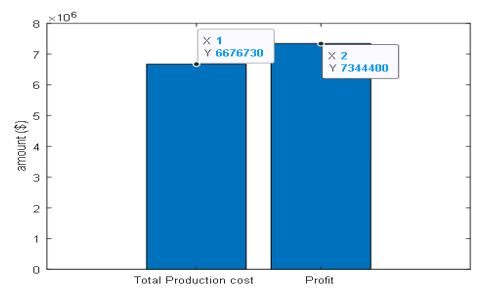
Figure 4.7: Total Production cost (TPC) and Profit achieved
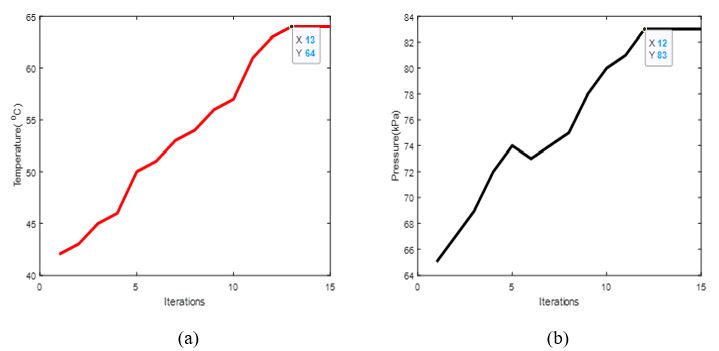
Figure 4.8: De-ethanizer (a) Temperature and (b) pressure progress during optimization
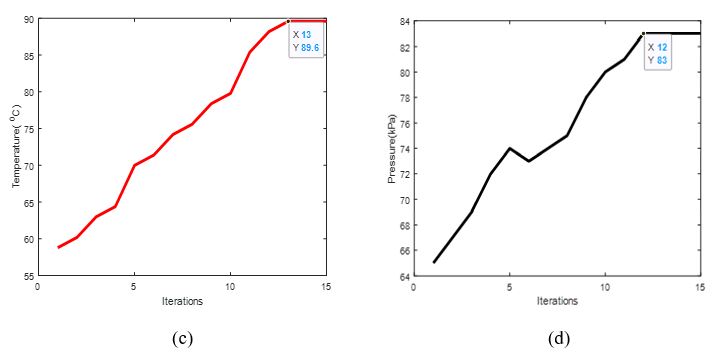
Figure 4.9: Optimized De-butanizer inlet (c) temperature (d) Pressure
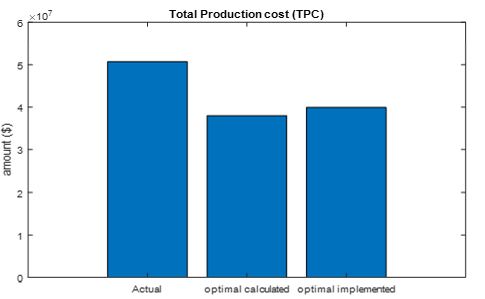
Figure 4.10: Optimal TPC
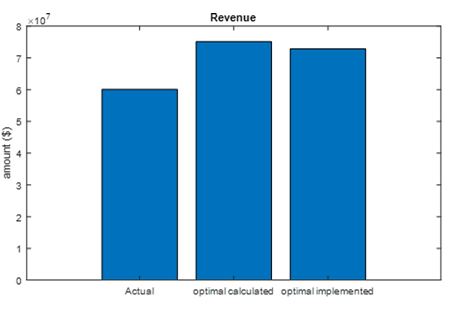
Figure 4.11: Optimal Revenue
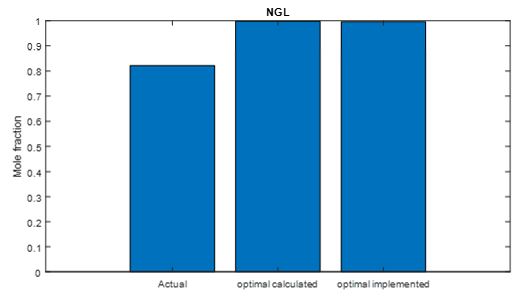
Figure 4.7: Optimal NGL
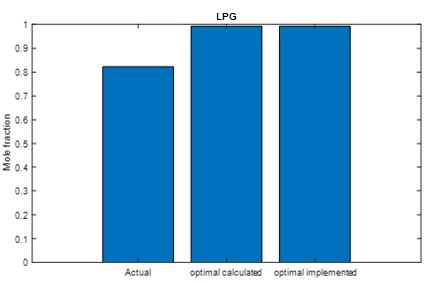
Figure 4.8: Optimal LPG purity
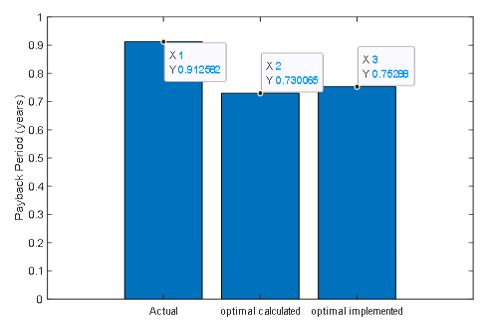
Figure 4.9: Analysis of Payback Period
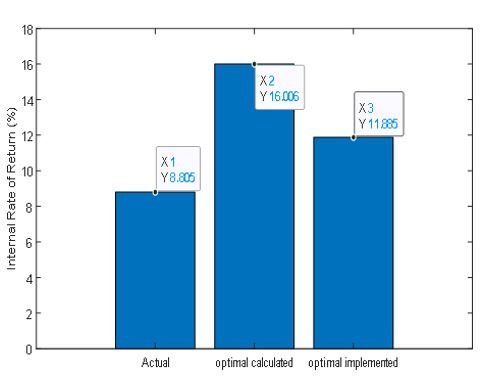
Figure 4.10: IRR comparative analysis
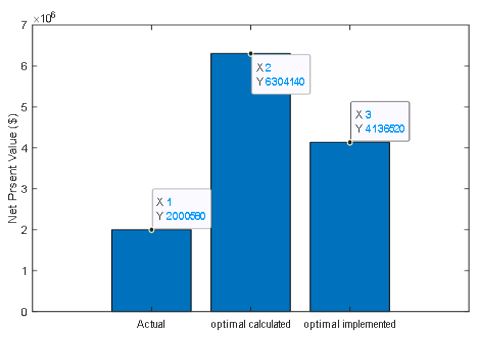
Figure 4.11: NPV comparative analysis
Tables at a glance
Figures at a glance