Table 1: Characterization of raw and treated Pumpkin stalk biomass
Table 2.0: SEM-EDX for of pumpkin stalk fiberboard produced
Table 3.0 Response Surface Methodology Result for Pumpkin treated with NaOH
Table 4: ANOVA of Pumpkin treated with NaOH with interaction model
Table 5: ANOVA of Pumpkin treated with NaOH with quadratic model
Table 6: Actual and predicted response
Table 7: Optimization of the RSM and ANFIS (quadratic model) using Genetic Algorithm
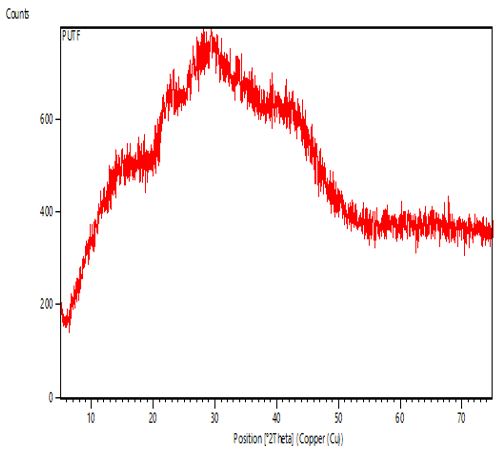
Figure 1.0: XRD graphs of UPF
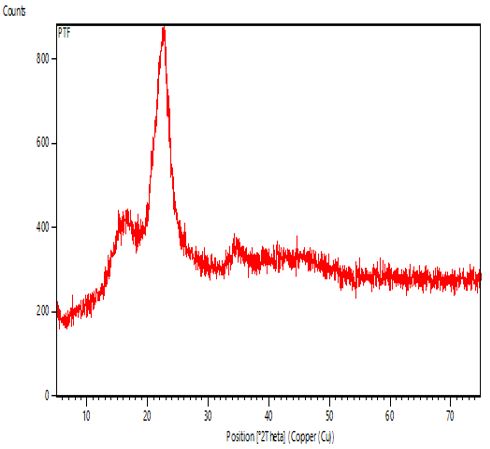
Figure 2.0: XRD graphs of TPF
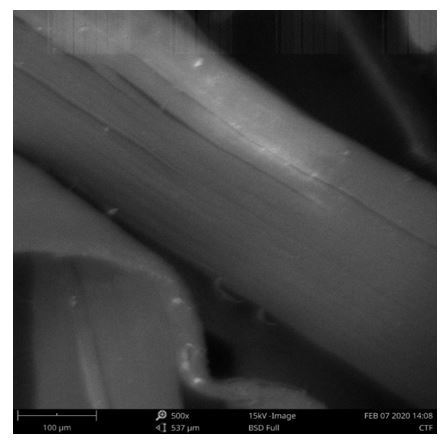
Plate 1.0 SEM image of pumpkin stalk fiberboard produced
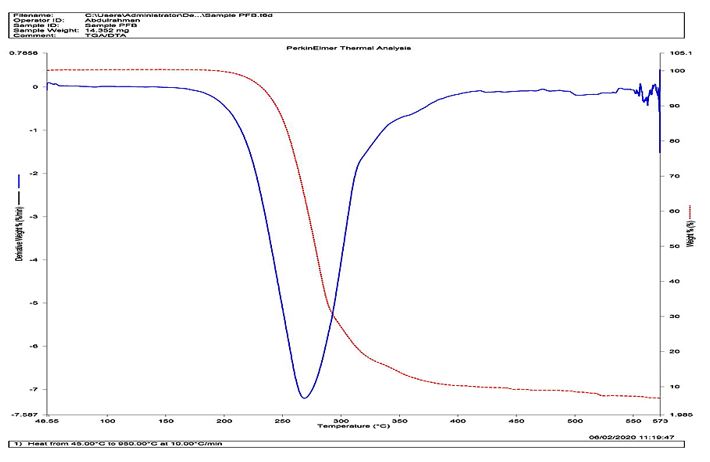
Figure 3.0: TGA/DSA of Pumpkin fiberboard
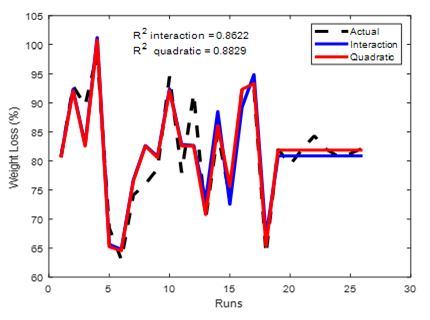
Figure 4: Comparative analysis for weight loss (RSM)
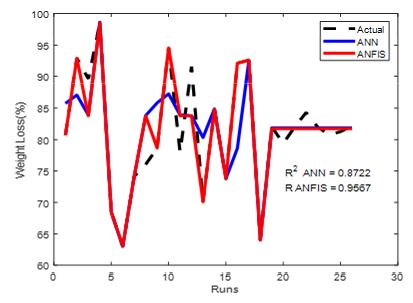
Figure 5: Comparative analysis for weight loss (ANN and ANFIS)
Tables at a glance
Figures at a glance