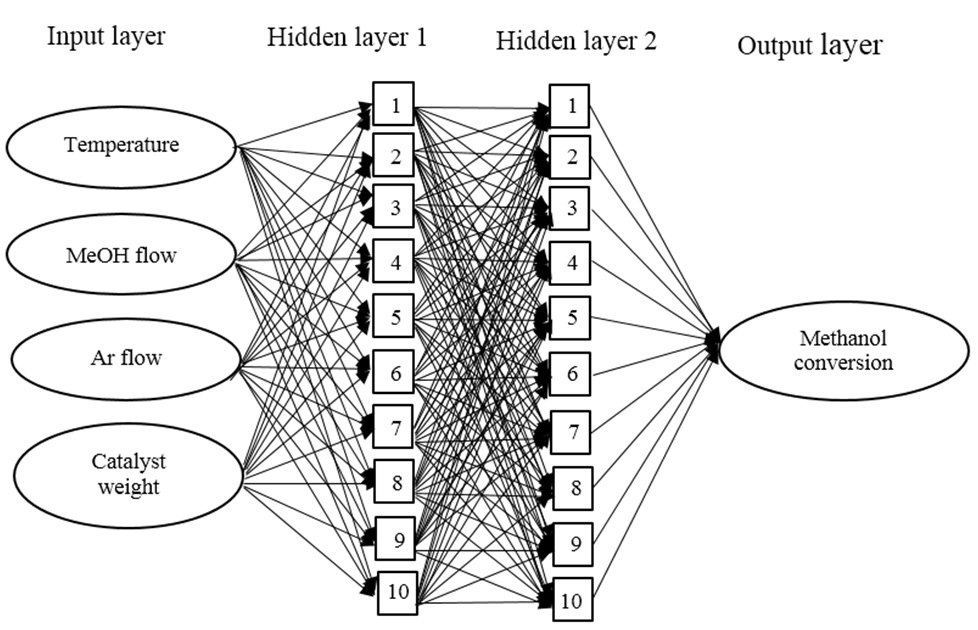
Figure 1 MTD ANN schematic
Figure 1 MTD ANN schematic
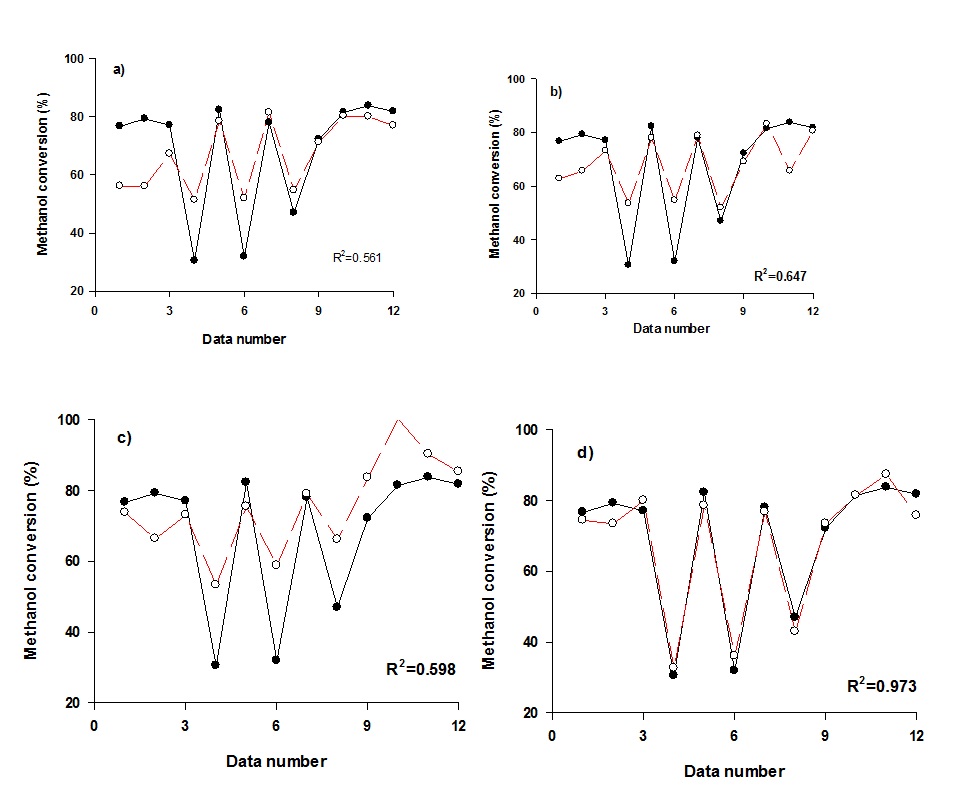
Figure 2 Methanol conversion parity plot for a) GDA b) RP c) GDX d) LM with optimal ANN structure. ( -●-experimental data and -○-predicted data)
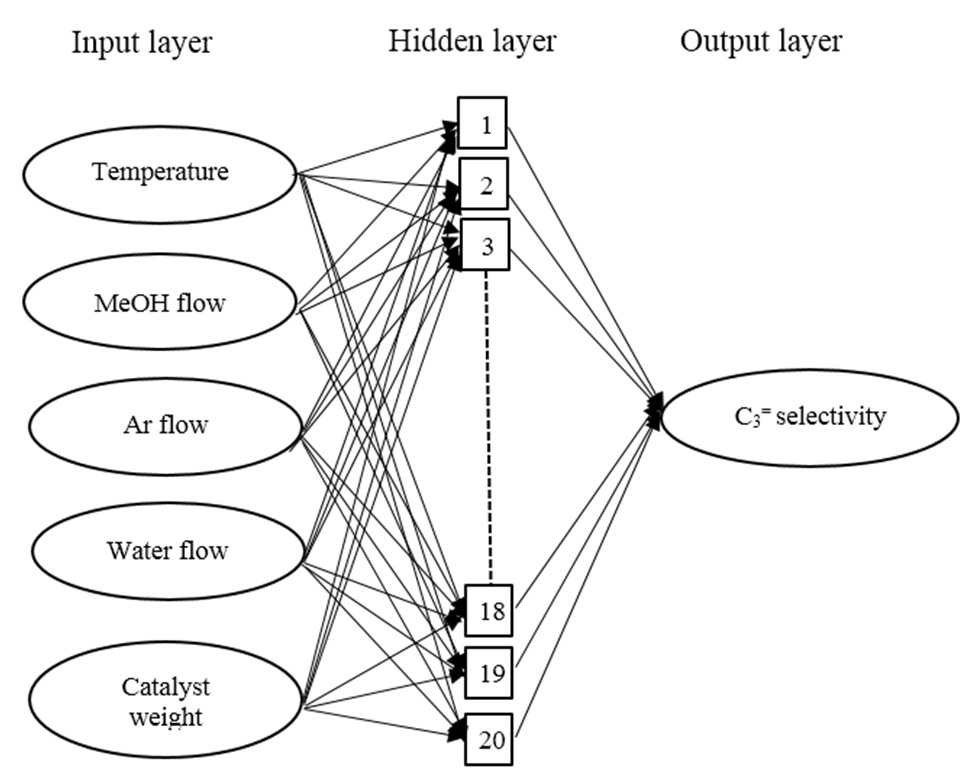
Figure 3 MTP ANNSchematic
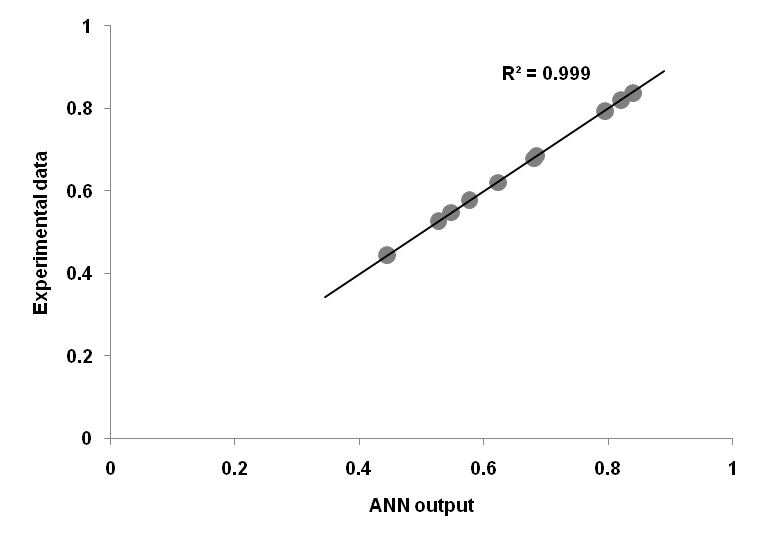
Figure 4 Propylene selectivity parity plot
Figure 5 Relative significance of the factors on methanol conversion (MTD) and propylene selectivity (MTP).
Figure 6 Propylene selectivity as function of operating condition: a) Catalyst mass and methanol flow b) Water flow and methanol flow c) Argon flow and methanol flow d) Argon flow and temperature
The advantages and disadvantages of various dye removal techniques [9, 11]
Temperature(◦C) |
Catalyst weight(g) |
MeOH flow(ml min−1) |
Ar flow(ml min−1) |
250 |
25 |
50.50 |
154 |
275 |
50 |
309 |
613 |
290 |
100 |
792 |
1580 |
325 |
200 |
1250 |
2560 |
Variable levels for MTD reaction [32]
Temperature |
Catalyst weight(g) |
MeOH flow |
Argon flow |
water flow |
400 |
50 |
0.92 |
0 |
0 |
450 |
110 |
1.84 |
139.50 |
0.92 |
500 |
220 |
2.50 |
1144 |
1.50 |
550 |
330 |
3.68 |
2288 |
1.84 |
Variable levels for MTP reaction [31]
Structure Transfer Function R2 RMSE
4-5-1 |
TS-PL |
0.961 |
0.016 |
4-10-1 |
TS-PL |
0.900 |
0.007 |
4-15-1 |
TS-PL |
0.918 |
0.003 |
4-20-1 |
TS-PL |
0.820 |
0.097 |
4-50-1 |
TS-PL |
0.660 |
0.026 |
4-5-1 |
TS-TS |
0.899 |
0.048 |
4-5-1 |
LS-PL |
0.799 |
0.048 |
4-5-1 |
PL-PL |
0.890 |
0.012 |
4-5-10-1 |
TS-TS-PL |
0.890 |
0.041 |
4-5-20-1 |
TS-TS-PL |
0.820 |
0.079 |
4-10-10-1a |
TS-TS-PL |
0.973 |
0.012 |
4-15-50-1 |
TS-TS-PL |
0.820 |
0.062 |
4-10-10-1 |
LS-LS-PL |
0.930 |
0.061 |
4-10-10-10-1 |
TS-TS-TS-PL |
0.850 |
0.067 |
Details of the various examined MTD ANNs with LM algorithm
Kinetic model |
Reactor model |
R2 |
Kaarsholm et al. 32 |
Fluidized bed |
0.901 |
|
6 CSTR’s |
0.940 |
Bercic and Levec 32 |
Fluidized bed |
0.884 |
|
6 CSTR’s |
0.925 |
MTD ANN |
|
0.973 |
Comparison of different models for MTD reaction
Table 6: Details of the various examined ANNs for MTP
Structure |
Learning Algorithm |
Transfer Function |
R2 RMSE |
|
5-5-1 |
LM |
TS-PL |
0.639 |
0.076 |
5-15-1 |
LM |
TS-PL |
0.976 |
0.012 |
5-20-1a |
LM |
TS-PL |
0.999 |
0.0007 |
5-25-1 |
LM |
TS-PL |
0.915 |
0.025 |
5-30-1 |
LM |
TS-PL |
0.827 |
0.032 |
5-50-1 |
LM |
TS-PL |
0.934 |
0.022 |
5-20-1 |
GDX |
TS-PL |
0.354 |
0.065 |
5-20-1 |
RP |
TS-PL |
0.562 |
0.064 |
5-20-1 |
BR |
TS-PL |
0.279 |
0.076 |
5-20-10-1 |
LM |
TS-TS-PL |
0.565 |
0.060 |
5-20-20-1 |
LM |
TS-TS-PL |
0.408 |
0.071 |
5-20-50-1 |
LM |
TS-TS-PL |
0.208 |
0.094 |
5-20-10-1 |
LM |
TS-LS-PL |
0.329 |
0.125 |
5-10-10-1 |
LM |
LS-LS-PL |
0.552 |
0.062 |
a Optimum MTP ANN topology