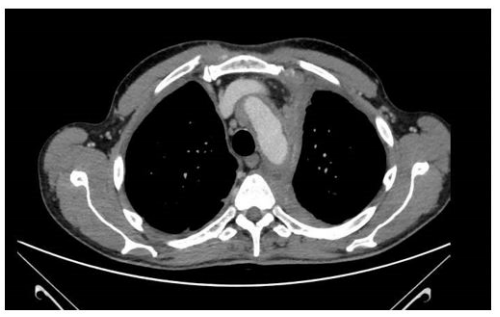
Figure 1 Venous contrast enhanced phase CT scan showing the periaortic sheathing (coated aorta)
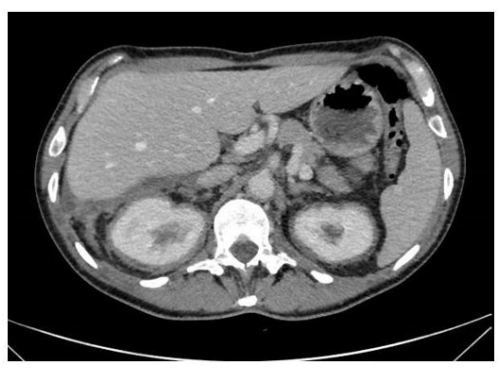
Figure 2 Venous contrast enhanced phase CT scan showing the perirenal fat infiltration (hairy kidneys)
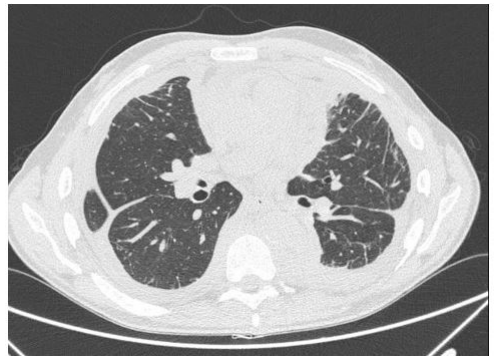
Figure 3 Thoracic HRCT Scan Showing lung involvement and the pleural Sheath
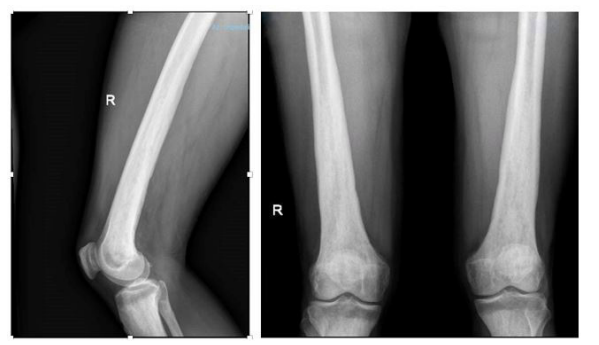
Figure 4 X-rays showing symmetrical cortical osteosclerosis of long bones
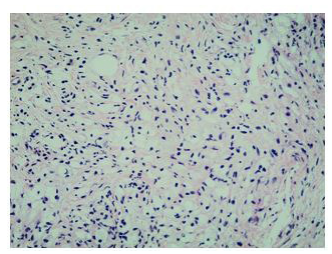
Figure 5 Biopsy specimen of perirenal adipose tissue stained with hematoxylin and eosin
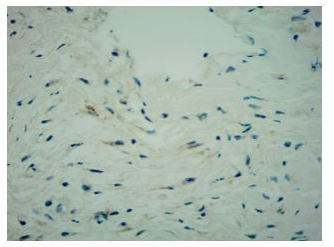
Figure 6 Immunohistochemical examination of a biopsy specimen of perirenal adipose tissue showing rare S100 positive cells
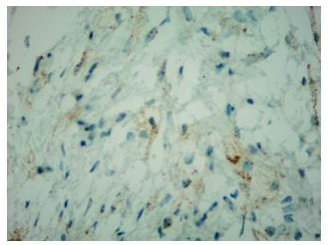
Figure 7 Immunohistochemical examination of perirenal adipose tissue biopsy specimen showing reactive BRAF V600E with fine cytoplasmic granules
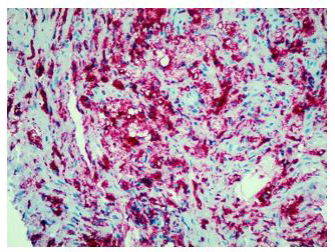
Figure 8 Immunohistochemical examination on a biopsy specimen of perirenal adipose tissue showing positivity for CD68
Figures at a glance