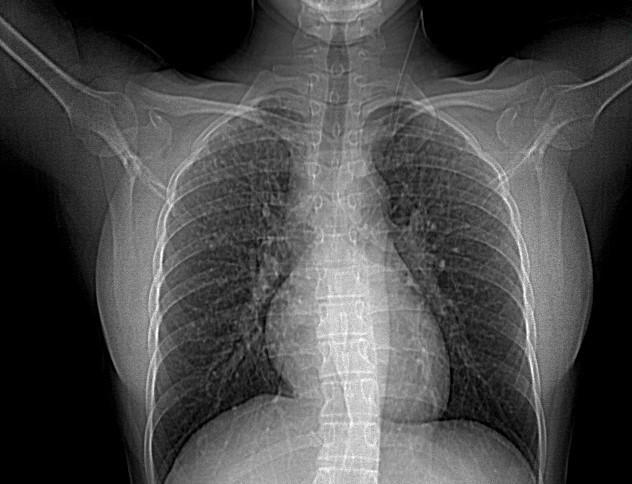
Figure 1: Chest radiograph depicting diffuse interstitial nodular opacities throughout the lungs bilaterally with hilums increased in volume.
Figure 1: Chest radiograph depicting diffuse interstitial nodular opacities throughout the lungs bilaterally with hilums increased in volume.
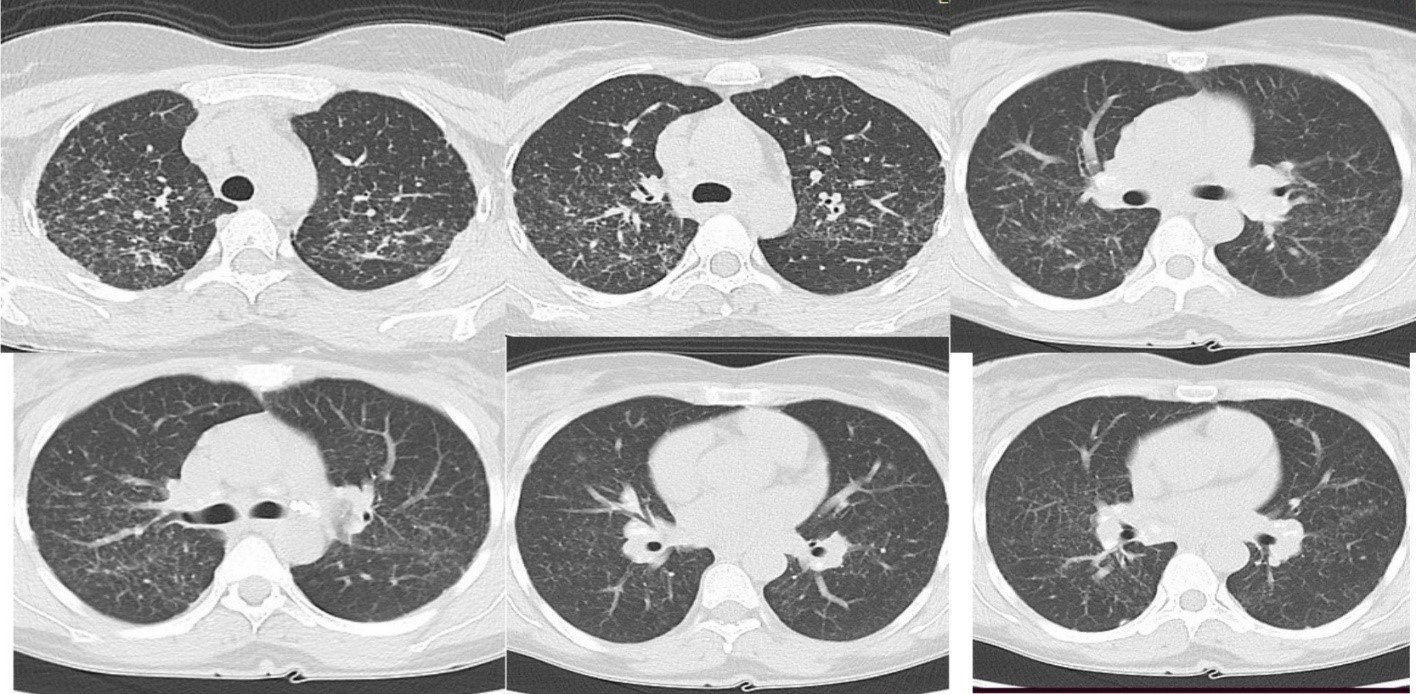
Figure 2: Computed tomography of the chest with intravenous contrast depicting mid and upper lung nodularity with a perilymphatic distribution involving the central peribronchial vascular regions as well as subpleural and fissural surfaces.
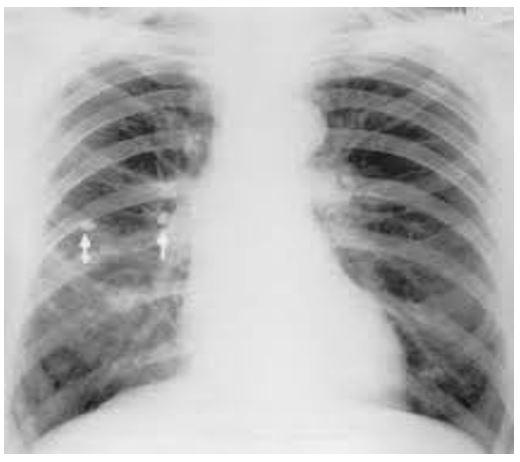
Figure 3: Chest X-ray shows diffusely dispersed reticulonodular opacities, more pronounced in the parahilar region, predominantly peripheral Kerley B lines. Deformation of the hilum with hilar adenopathy, small fluid collection on the left, with the penetration of the fluid into the interlobar fissure.
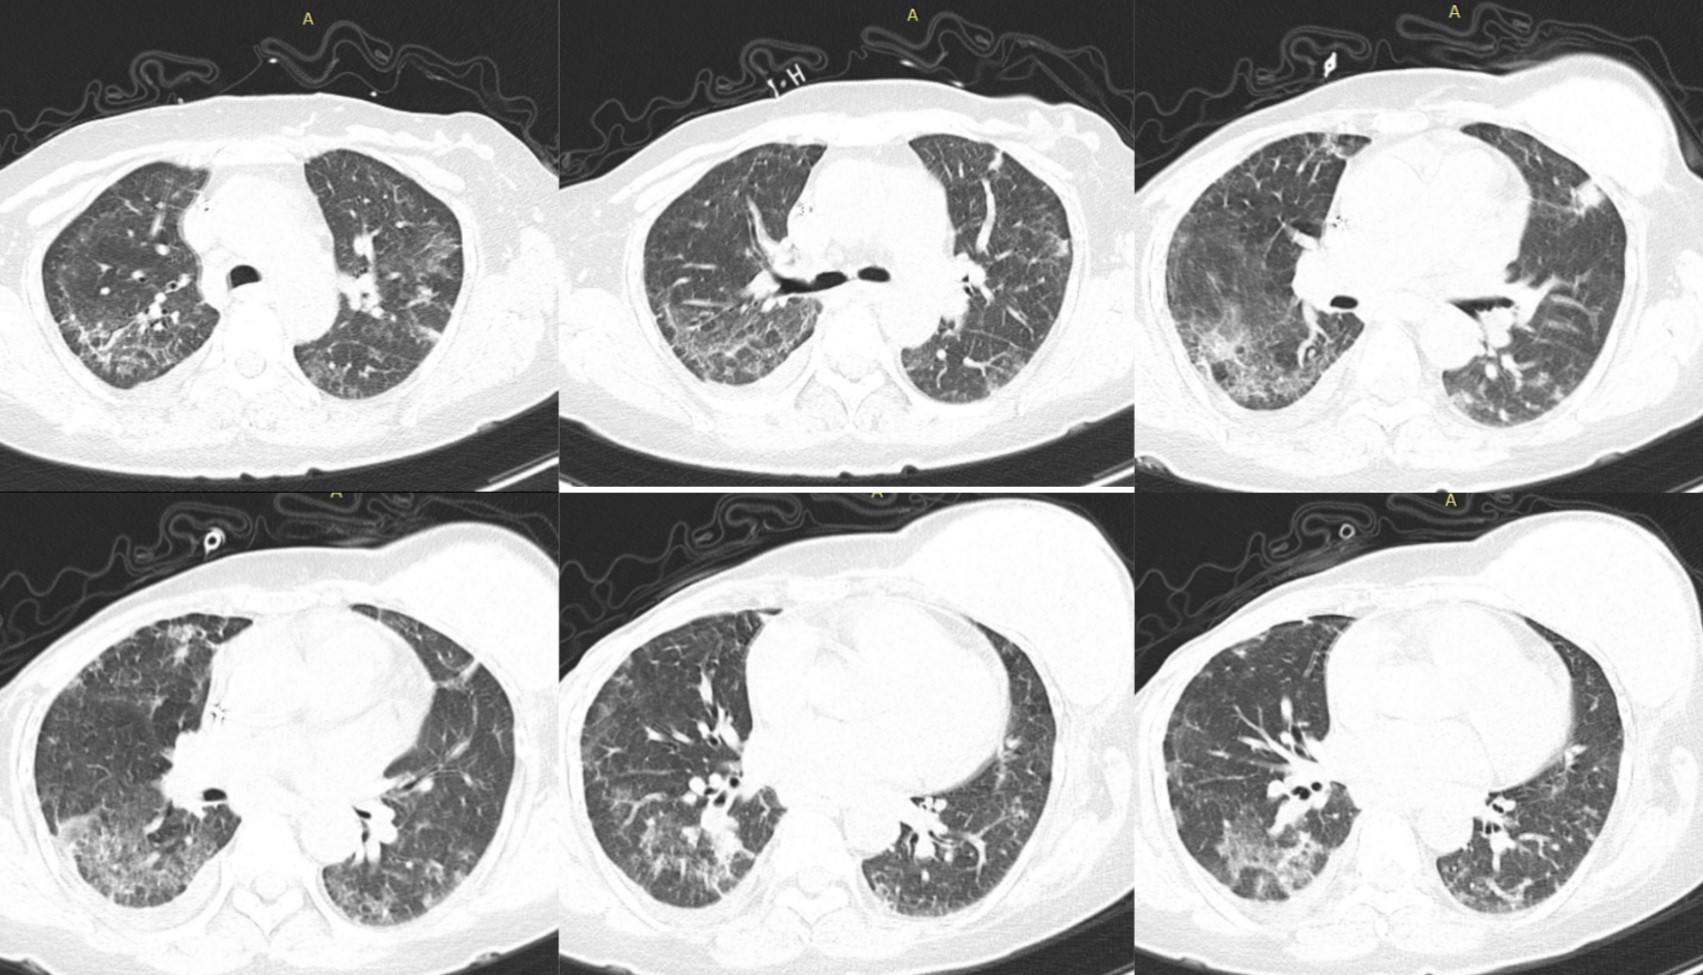
Figure 4: Thoracic CT in the pulmonary window shows reticular linear interstitial densifications, on the background of some diffuse areas in ground glass of reduced intensity, right pleural collection 7 mm.
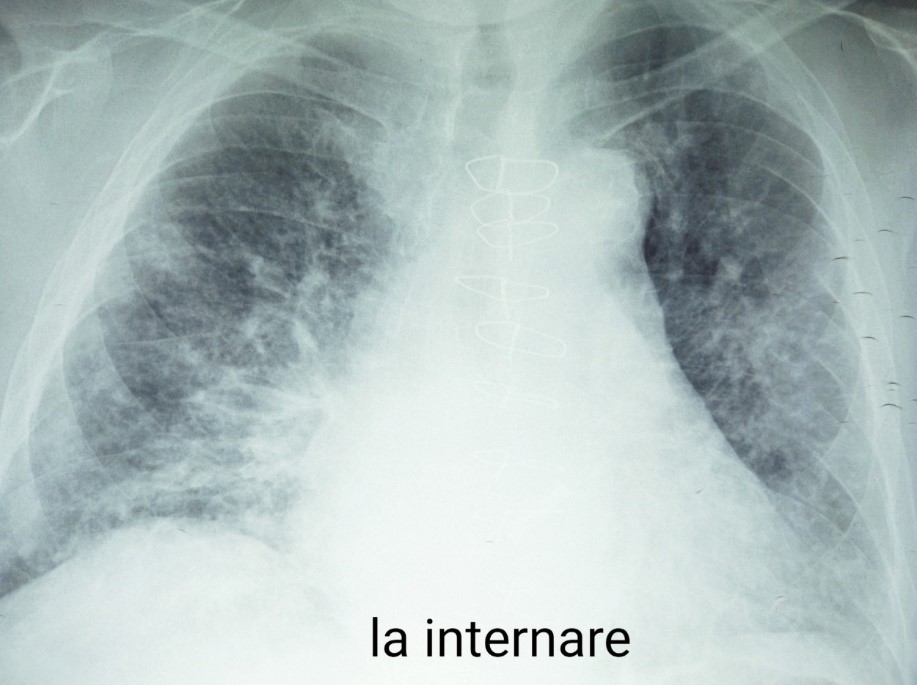
Figure 5: Chest X-Ray shows nodular infiltrative opacities in frosted glass with a predominant subpleural and basal bilateral disposition
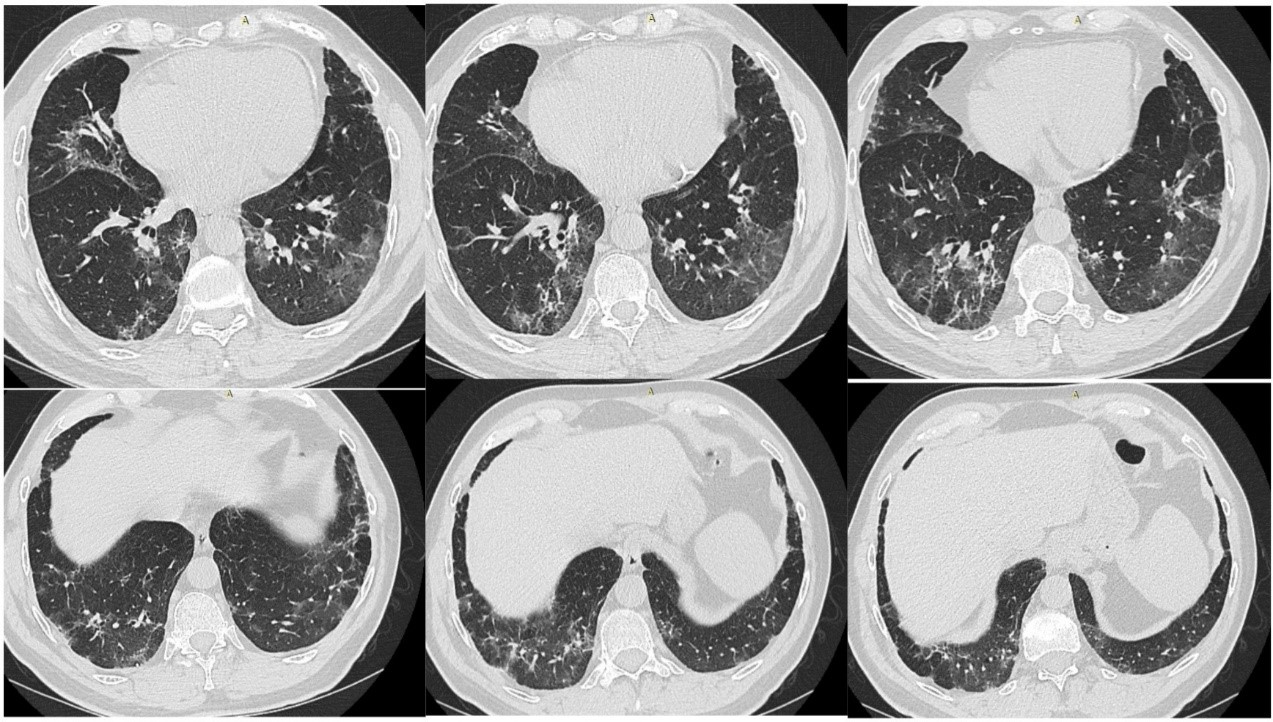
Figure 6: Chest computed tomography reveals bilateral peripheral ground-glass infiltrates in both lung fields, with a predominantly peripheral and basal disposition
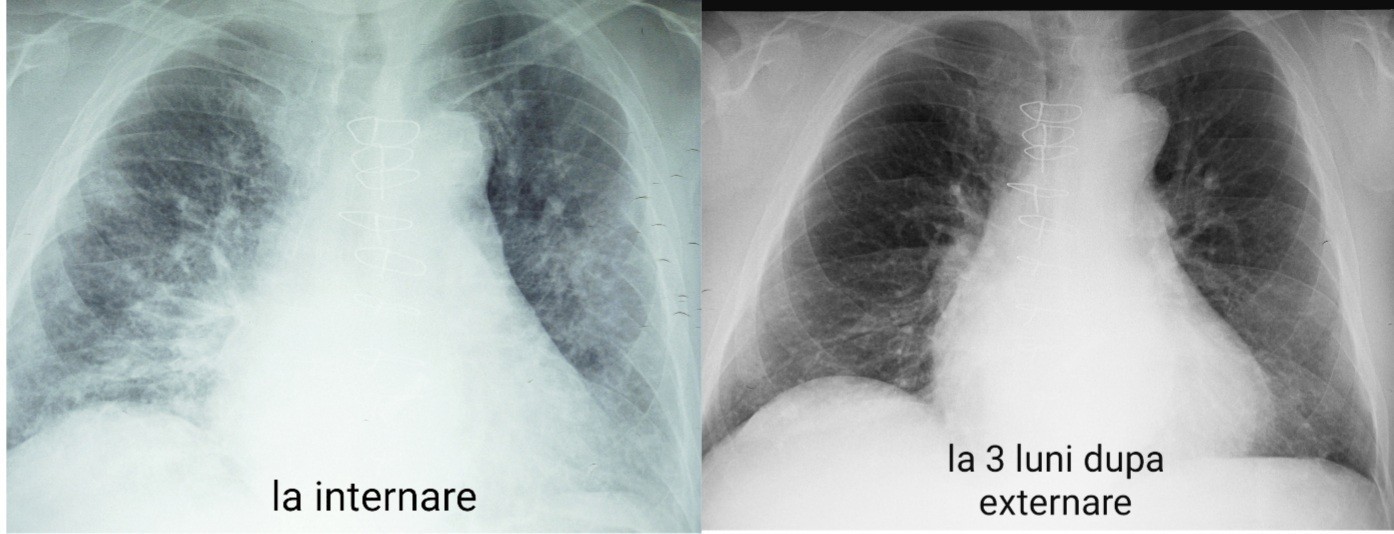
Figure 7: Comparative lung X-ray at admission and 3 months after discharge - a significant regression of interstitial infiltrates was observed 3 months after discharge.
Figures at a glance