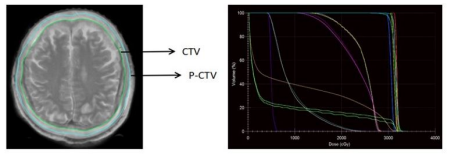
Figure 1: Target area map (left) and DVH diagram of group A at the first stage
Program |
Scores |
Scores |
|
0 |
1 |
KPS |
50~70 |
80~100 |
Primary lesion control |
no |
yes |
Extracranial metastasis |
yes |
no |
Table 1: Basic score for brain metastases
Program |
Scores |
Scores |
Scores |
0 |
0.5 |
1 |
|
Age (y) |
>60 |
50~59 |
<50 |
KPS |
<70 |
70~80 |
90~100 |
Number of lesions |
>3 |
2~3 |
1 |
Extracranial metastasis |
yes |
- |
no |
Table 2: Grading prognostic assessment
|
|
Group A |
Group B |
P |
Age (y) |
<60 |
16 |
22 |
0.799 |
≥60 |
14 |
17 |
||
Gender |
Male |
18 |
24 |
0.897 |
Female |
12 |
15 |
||
Pathology |
Non-adenocarcinoma |
8 |
8 |
0.548 |
Adenocarcinoma |
22 |
31 |
||
Number of lesions |
≤3 |
15 |
23 |
0.458 |
>3 |
15 |
16 |
||
Gene mutation |
Yes |
12 |
17 |
0.765 |
No |
18 |
22 |
||
KPS |
<80 |
8 |
8 |
0.548 |
≥80 |
22 |
31 |
||
RPA |
Level I |
6 |
4 |
0.254 |
Level II |
24 |
35 |
Table 3: Analysis of patients �clinical characteristics
|
Group A (n=30) |
Group B (n=39) |
Z |
P |
BS-BM |
2.00(1.00,3.00) |
1.00(1.00,2.00) |
-1.446 |
0.148 |
GPA |
1.50(0.88,2.13) |
1.50(1.00,2.00) |
-0.260 |
0.795 |
Table 4: BS-BM and GPA
|
Group A (n=30) |
Group B (n=39) |
t |
P |
Before radiotherapy |
24.33±2.96 |
23.74±3.67 |
0.719 |
0.475 |
At the end of radiotherapy |
24.33±2.99 |
23.67±3.73 |
0.801 |
0.426 |
1 month after radiotherapy |
23.21±3.1 |
22.38±4.62 |
0.827 |
0.411 |
3 months after radiotherapy |
22.65±3.77 |
21.28±4.35 |
1.299 |
0.199 |
6 months after radiotherapy |
22.41±3.43 |
21.19±4.13 |
1.098 |
0.278 |
Table 5: Difference analysis of two groups of patients at the same treatment stage
|
Baseline level |
Different treatment stages |
P |
Before radiotherapy - 1 month after radiotherapy |
24.33±2.96 |
24.33±2.99 |
1.000 |
Before radiotherapy - 3 months after radiotherapy |
24.33±2.96 |
23.21±3.1 |
0.002 |
Before radiotherapy - 6 months after radiotherapy |
24.33±2.96 |
22.65±3.77 |
0.000 |
1 month after radiotherapy - 3 months after radiotherapy |
24.33±2.96 |
22.41±3.43 |
0.003 |
3 months after radiotherapy - 6 months after radiotherapy |
23.21±3.1 |
22.65±3.77 |
0.032 |
Before radiotherapy - 1 month after radiotherapy |
22.65±3.77 |
22.41±3.43 |
1.000 |
Table 6: Cognitive Function Differences of Patients in Group A at Each Treatment Stage
|
Baseline level |
Different treatment stages |
P |
Before radiotherapy - 1 month after radiotherapy |
23.74±3.67 |
23.67±3.73 |
0.412 |
Before radiotherapy - 3 months after radiotherapy |
23.74±3.67 |
22.38±4.62 |
0.000 |
Before radiotherapy - 6 months after radiotherapy |
23.74±3.67 |
21.28±4.35 |
0.000 |
1 month after radiotherapy - 3 months after radiotherapy |
23.74±3.67 |
21.19±4.13 |
0.000 |
3 months after radiotherapy - 6 months after radiotherapy |
22.38±4.62 |
21.28±4.35 |
0.000 |
Before radiotherapy - 1 month after radiotherapy |
21.28±4.35 |
21.19±4.13 |
0.478 |
Table 7: Cognitive Function Differences of Patients in Group B at Each Treatment Stage
Age<60 |
Groups |
Number |
Average |
standard deviation |
t |
P |
Before radiotherapy |
Group A |
16 |
25.13 |
2.391 |
1.248 |
0.22 |
Group B |
22 |
23.77 |
3.816 |
|||
At the end of radiotherapy |
Group A |
16 |
25.31 |
2.522 |
1.522 |
0.137 |
Group B |
22 |
23.64 |
3.836 |
|||
1 month after radiotherapy |
Group A |
15 |
24.27 |
2.631 |
1.657 |
0.107 |
Group B |
21 |
22 |
4.796 |
|||
3 months after radiotherapy |
Group A |
15 |
24 |
2.582 |
1.617 |
0.115 |
Group B |
20 |
22.05 |
4.293 |
|||
6 months after radiotherapy |
Group A |
12 |
23.83 |
3.129 |
1.605 |
0.121 |
Group B |
15 |
21.4 |
4.437 |
|||
Age≥60 |
|
|
|
|
|
|
Before radiotherapy |
Group A |
14 |
23.43 |
3.368 |
-0.22 |
0.827 |
Group B |
17 |
23.71 |
3.584 |
|||
At the end of radiotherapy |
Group A |
14 |
23.21 |
3.167 |
-0.392 |
0.698 |
Group B |
17 |
23.71 |
3.704 |
|||
1 month after radiotherapy |
Group A |
13 |
22 |
3.24 |
-0.59 |
0.56 |
Group B |
16 |
22.88 |
4.47 |
|||
3 months after radiotherapy |
Group A |
11 |
20.73 |
3.977 |
-0.404 |
0.689 |
Group B |
16 |
21.38 |
4.161 |
|||
6 months after radiotherapy |
Group A |
10 |
20.7 |
3.093 |
-0.136 |
0.893 |
Group B |
11 |
20.91 |
3.859 |
Table 8: Analysis of age subgroups
Male |
Groups |
Number |
Average |
Standard deviation |
t |
P |
Before radiotherapy |
Group A |
18 |
25.61 |
1.883 |
1.323 |
0.193 |
Group B |
24 |
24.46 |
3.31 |
|||
At the end of radiotherapy |
Group A |
18 |
25.56 |
1.756 |
1.211 |
0.233 |
Group B |
24 |
24.5 |
3.362 |
|||
1 month after radiotherapy |
Group A |
16 |
24.56 |
2.337 |
0.981 |
0.333 |
Group B |
22 |
23.45 |
4.044 |
|||
3 months after radiotherapy |
Group A |
16 |
24 |
2.582 |
1.617 |
0.115 |
Group B |
22 |
22.05 |
4.293 |
|||
6 months after radiotherapy |
Group A |
12 |
23.25 |
2.958 |
1.038 |
0.31 |
Group B |
14 |
21.79 |
4.042 |
|||
Female |
|
|
|
|
|
|
Before radiotherapy |
Group A |
12 |
22.42 |
3.315 |
-0.127 |
0.9 |
Group B |
15 |
22.6 |
4.032 |
|||
At the end of radiotherapy |
Group A |
12 |
22.5 |
3.555 |
0.113 |
0.911 |
Group B |
15 |
22.33 |
4.012 |
|||
1 month after radiotherapy |
Group A |
12 |
21.42 |
3.147 |
0.367 |
0.715 |
Group B |
15 |
20.8 |
5.074 |
|||
3 months after radiotherapy |
Group A |
10 |
20.5 |
4.478 |
0.236 |
0.815 |
Group B |
14 |
20.07 |
4.305 |
|||
6 months after radiotherapy |
Group A |
10 |
21.4 |
3.836 |
0.513 |
0.613 |
Group B |
12 |
20.5 |
4.296 |
Table 9: Gender subgroup analysis
Gene mutation |
Groups |
Number |
Average |
Standard deviation |
t |
P |
Before radiotherapy |
Group A |
18 |
24.500 |
2.956 |
0.701 |
0.487 |
Group B |
22 |
23.770 |
3.491 |
|||
At the end of radiotherapy |
Group A |
18 |
24.390 |
2.893 |
0.680 |
0.501 |
|
Group B |
22 |
23.680 |
3.551 |
|
|
1 month after radiotherapy |
Group A |
16 |
22.750 |
3.000 |
0.079 |
0.937 |
Group B |
20 |
22.650 |
4.271 |
|||
3 months after radiotherapy |
Group A |
15 |
21.930 |
3.751 |
0.842 |
0.406 |
Group B |
20 |
20.800 |
4.073 |
|||
6 months after radiotherapy |
Group A |
12 |
21.580 |
3.528 |
0.417 |
0.681 |
Group B |
13 |
21.000 |
3.464 |
|||
No gene mutation |
|
|
|
|
|
|
Before radiotherapy |
Group A |
12 |
24.080 |
3.088 |
0.274 |
0.786 |
Group B |
17 |
23.710 |
3.996 |
|||
At the end of radiotherapy |
Group A |
12 |
24.250 |
3.251 |
0.426 |
0.673 |
Group B |
17 |
23.650 |
4.061 |
|||
1 month after radiotherapy |
Group A |
12 |
23.830 |
3.243 |
1.060 |
0.299 |
Group B |
17 |
22.060 |
5.105 |
|||
3 months after radiotherapy |
Group A |
11 |
23.640 |
3.749 |
1.030 |
0.313 |
Group B |
16 |
21.880 |
4.731 |
|||
6 months after radiotherapy |
Group A |
10 |
23.400 |
3.204 |
1.136 |
0.269 |
Group B |
13 |
21.380 |
4.840 |
Table 10: Gene mutation subgroup analysis
Non-adenocarcinoma |
Groups |
Number |
Average |
Standard deviation |
t |
P |
Before radiotherapy |
Group A |
8 |
25.500 |
2.268 |
-0.744 |
0.469 |
Group B |
8 |
24.380 |
3.623 |
|||
At the end of radiotherapy |
Group A |
8 |
25.250 |
2.252 |
-0.567 |
0.580 |
Group B |
8 |
24.380 |
3.739 |
|||
1 month after radiotherapy |
Group A |
6 |
23.000 |
1.789 |
-0.370 |
0.718 |
Group B |
8 |
22.250 |
4.683 |
|||
3 months after radiotherapy |
Group A |
6 |
21.830 |
2.639 |
-0.334 |
0.744 |
Group B |
8 |
20.630 |
4.534 |
|||
6 months after radiotherapy |
Group A |
4 |
22.250 |
2.872 |
-0.827 |
0.440 |
Group B |
4 |
19.750 |
4.924 |
|||
Adenocarcinoma |
|
|
|
|
|
|
Before radiotherapy |
Group A |
22 |
23.910 |
3.115 |
0.338 |
0.737 |
Group B |
31 |
23.580 |
3.722 |
|||
At the end of radiotherapy |
Group A |
22 |
24.000 |
3.192 |
0.523 |
0.603 |
Group B |
31 |
23.480 |
3.767 |
|||
1 month after radiotherapy |
Group A |
22 |
23.270 |
3.397 |
0.727 |
0.471 |
Group B |
29 |
22.410 |
4.679 |
|||
3 months after radiotherapy |
Group A |
20 |
22.900 |
4.077 |
1.155 |
0.254 |
Group B |
28 |
21.460 |
4.359 |
|||
6 months after radiotherapy |
Group A |
18 |
22.440 |
3.617 |
0.807 |
0.425 |
Group B |
22 |
21.450 |
4.044 |
Table 11: Analysis of subgroups of different pathological types
KPS <80 |
Groups |
Number |
Average |
Standard deviation |
t |
P |
Before radiotherapy |
Group A |
8 |
22.380 |
3.462 |
-0.388 |
0.704 |
Group B |
8 |
23.130 |
4.224 |
|||
At the end of radiotherapy |
Group A |
8 |
22.130 |
3.044 |
-0.620 |
0.545 |
Group B |
8 |
23.250 |
4.132 |
|||
1 month after radiotherapy |
Group A |
7 |
21.000 |
3.109 |
-0.228 |
0.824 |
Group B |
6 |
21.500 |
4.764 |
|||
3 months after radiotherapy |
Group A |
6 |
19.830 |
3.545 |
0.367 |
0.721 |
Group B |
6 |
19.000 |
4.290 |
|||
6 months after radiotherapy |
Group A |
5 |
20.400 |
3.362 |
0.164 |
0.824 |
Group B |
5 |
20.000 |
4.301 |
|||
KPS≥80 |
|
|
|
|
|
|
Before radiotherapy |
Group A |
22 |
25.050 |
2.478 |
1.294 |
0.202 |
Group B |
31 |
23.900 |
3.572 |
|||
At the end of radiotherapy |
Group A |
22 |
25.140 |
2.587 |
1.491 |
0.142 |
Group B |
31 |
23.770 |
3.685 |
|||
1 month after radiotherapy |
Group A |
21 |
23.950 |
2.783 |
1.240 |
0.221 |
Group B |
31 |
22.550 |
4.646 |
|||
3 months after radiotherapy |
Group A |
20 |
23.500 |
3.487 |
1.535 |
0.310 |
Group B |
30 |
21.730 |
4.283 |
|||
6 months after radiotherapy |
Group A |
17 |
23.000 |
3.317 |
1.230 |
0.227 |
Group B |
21 |
21.480 |
4.143 |
Table 12: Analysis of different KPS scoring subgroups
Number of lesions≤3 |
Groups |
Number |
Average |
Standard deviation |
t |
P |
Before radiotherapy |
Group A |
15 |
25.270 |
2.219 |
1.965 |
0.056 |
Group B |
23 |
23.530 |
3.674 |
|||
At the end of radiotherapy |
Group A |
15 |
25.400 |
2.414 |
2.094 |
0.043 |
|
Group B |
23 |
23.470 |
3.730 |
|
|
1 month after radiotherapy |
Group A |
15 |
24.000 |
2.449 |
1.604 |
0.187 |
Group B |
21 |
22.250 |
4.703 |
|||
3 months after radiotherapy |
Group A |
14 |
23.710 |
2.998 |
2.212 |
0.033 |
Group B |
21 |
20.890 |
4.263 |
|||
6 months after radiotherapy |
Group A |
12 |
23.170 |
3.186 |
1.764 |
0.088 |
Group B |
19 |
20.810 |
3.945 |
|||
Number of lesions>3 |
|
|
|
|
|
|
Before radiotherapy |
Group A |
15 |
23.400 |
3.376 |
-0.702 |
0.490 |
Group B |
16 |
24.440 |
3.779 |
|||
At the end of radiotherapy |
Group A |
15 |
23.270 |
3.195 |
-0.732 |
0.472 |
Group B |
16 |
24.330 |
3.873 |
|||
1 month after radiotherapy |
Group A |
13 |
22.310 |
3.591 |
-0.270 |
0.790 |
Group B |
16 |
22.780 |
4.577 |
|||
3 months after radiotherapy |
Group A |
12 |
21.420 |
4.316 |
-0.595 |
0.560 |
Group B |
15 |
22.630 |
4.658 |
|||
6 months after radiotherapy |
Group A |
10 |
21.500 |
3.659 |
-0.578 |
0.573 |
Group B |
12 |
22.800 |
4.970 |
Table 13: Analysis of subgroups with different number of lesions
|
Group A |
Group B |
2 |
P |
DCR |
96.00% |
84.00% |
0.09 |
0.764 |
ORR |
84.00% |
80.00% |
0.156 |
0.693 |
Table 14: DCR and ORR
|
CR |
PR |
SD |
PD |
6-month PFS rates |
2 |
P |
Group A |
2 |
7 |
2 |
11 |
50.0% |
0.375 |
0.371 |
Group B |
1 |
13 |
3 |
12 |
58.6% |
|
|
Table 15: 6-month PFS rates
Figure 1: Target area map (left) and DVH diagram of group A at the first stage
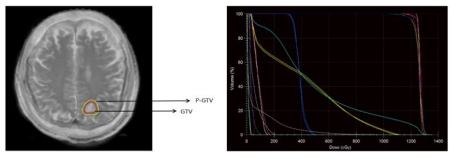
Figure 2: Target area diagram (left) and DVH diagram (diagram) of group A at the first stage
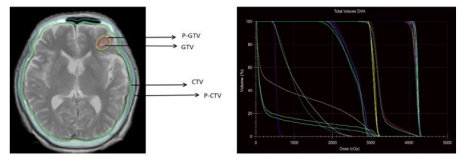
Supplementary Figure 1: Target area map (left) and DVH diagram (right) of group B
Tables at a glance
Figures at a glance