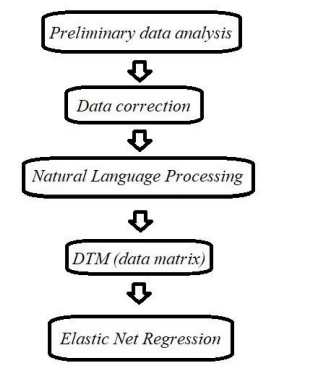
Figure 1: Statistical analysis Flowchart
Intrinsic factors |
ASCUS/HRHPV(-ve) |
ASCUS/HRHPV(+ve) |
Chi-squared |
P -value |
Inflammation |
669 (71%) |
273 (29%) |
|
NS |
Absent |
117 (12.4%) |
51 (5.4%) |
|
|
Present |
552 (58%) |
273 (23.6%) |
0.188 |
|
Reactive atypia |
669 (71%) |
273 (29%) |
|
|
Absent |
591 (62.7%) |
227 (24.1%) |
|
|
Present |
78 (8.3%) |
46 (4.9%) |
4.57 |
0.033* |
Atrophy |
669 (71%) |
273 (29%) |
|
|
Absent |
645 (68.5%) |
267 (28.3%) |
|
|
Present |
24 (2.5%) |
6 (0.6%) |
1.214 |
0.27 |
Fungal infection |
669 (71%) |
273 (29%) |
|
|
Absent |
634 (67.3%) |
248 (26.3%) |
|
|
Present |
35 (3.7%) |
25 (2.7%) |
5.01 |
0.025* |
Trichomonas vaginalis |
669 (71%) |
273 (29%) |
|
|
Absent |
667 (70.8) |
270 (28.7%) |
|
|
Present |
2 (0.2%) |
3 (0.3%) |
2.35 |
NS |
Blood |
669 (71%) |
273 (29%) |
|
|
Absent |
499 (53%) |
194 (20.6%) |
|
|
Present |
170 (18%) |
79 (8.4%) |
1.24 |
NS |
Shift in flora |
669 (71%) |
273 (29%) |
|
|
Absent |
578 (61.4%) |
203 (21.5%) |
|
|
Present |
91 (9.7%) |
70 (7.4%) |
19.83 |
<0.001* |
Table 1: Comparison of additional cytological findings of ASCUS/HRHPV negative vs. ASCUS/HRHPV positive groups (N=942)
Contributing factors |
Combination codea |
Influenceb |
Limited by obscuring factors (Recodespeci2) |
|
0.3914509 |
Atrophic epithelial changes. Moderate inflammation. Blood++. |
1 |
|
(Old) blood++ |
1 |
0.2688663 |
Atrophic epithelial changes are evident. Blood. |
2 |
|
Atrophy. Blood. Moderate inflammation. |
2 |
0.2444535 |
Shift in vaginal flora. Mild inflammation. |
3 |
|
Atrophic smear.Moderate to severe inflammation.Blood+. |
3 |
0.0676442 |
Abundant blood. Shift in vaginal bacterial flora. |
4 |
|
Blood + |
4 |
0.0676427 |
Abundant blood. Shift in vaginal flora. |
5 |
|
Background blood. |
5 |
0.0676427 |
Blood++. Moderate inflammation. |
|
0.0676426 |
blood2 |
|
0.051097 |
Atrophic smear. Mild inflammation. |
6 |
|
(Old) blood++ |
6 |
0.0169809 |
Atrophic smear.Moderate to severe inflammation.Blood+. |
|
0.0169792 |
Table 2: Significant contributing cytological factors of the optimal predictive model for an ASCUS/HRHPV negative outcome
a Similar combination codes refer to combinations of cytological descriptions that together significantly contributed to the model.bAll coefficients are significant at p<0.002.
p |
0 |
1 |
0 |
78 |
33 |
1 |
191 |
634 |
Table 3: The Confusion Matrix
Figure 1: Statistical analysis Flowchart
Tables at a glance
Figures at a glance