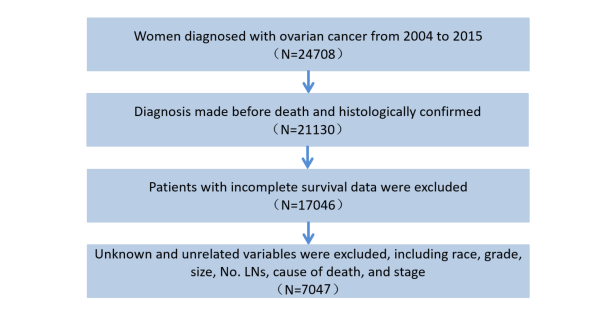
Figure 1: Screening flowchart for patients with ovarian cancer (OC)
Figure 1: Screening flowchart for patients with ovarian cancer (OC)
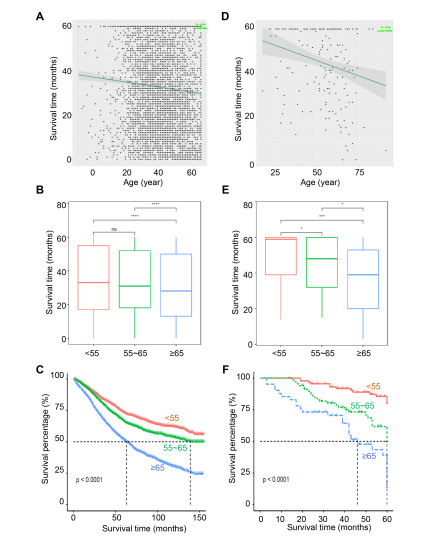
Figure 2: Age at diagnosis served as a reliable prognostic factor for ovarian cancer (OC). A-C, OC patients from the SEER database, 2004–2015. The correlation of age at diagnosis and the five years prognosis (A). The overall survival times (B) and the Kaplan–Meier curves (C) among the patients with different age groups. D-F, OC patients from China hospital, 2004–2015. The correlation of age at diagnosis and the five years prognosis (D). The overall survival times (E) and the Kaplan–Meier curves (F) among the patients with different age groups.
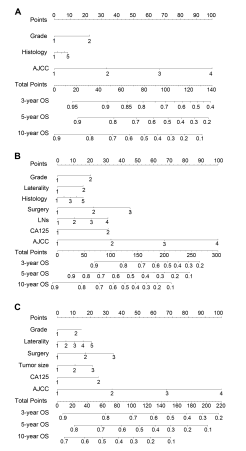
Figure 3: Nomogram to predict the 3-year, 5-year, and 10-year survival probability of ovarian cancer (OC) patients with less than 55 (A), 55-65 (B), and more than 65 years old (C).
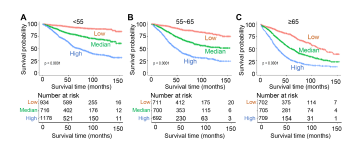
Figure 4: Survival analysis of the risk group in ovarian cancer (OC) patients with less than 55 (A), 55-65 (B), and more than 65 years old (C).
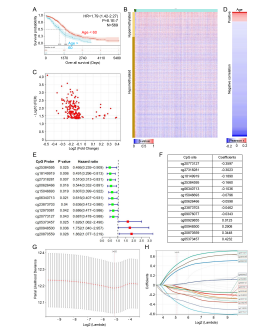
Figure 5: Construction an age-based DNA methylation prognostic signature. (A) The Kaplan–Meier survival plots of OC patients grouped by the age at diagnosis. (B) The heatmap of methylation profile of the significant different CpG sites between OC tumor and normal group. (C) Volcano diagram shown the methylation leve of CpG sites, that significantly related with OC outcomes. (D) Heatmap of the positive and negative correlation of methylation leve of CpG sites with age. (E) The distribution of the hazards ratios of the 12 CpG sites. (F) Table showing the coefficients of 13 CpG sites by LASSO Cox regression assay. (G) Coefficients of 13 CpG sites were selected by the lambda with the minimum binomial deviance marked by the black dashed line. (H) The LASSO binomial model fitting process. Each curve represents a variable.
Tables at a glance
Figures at a glance