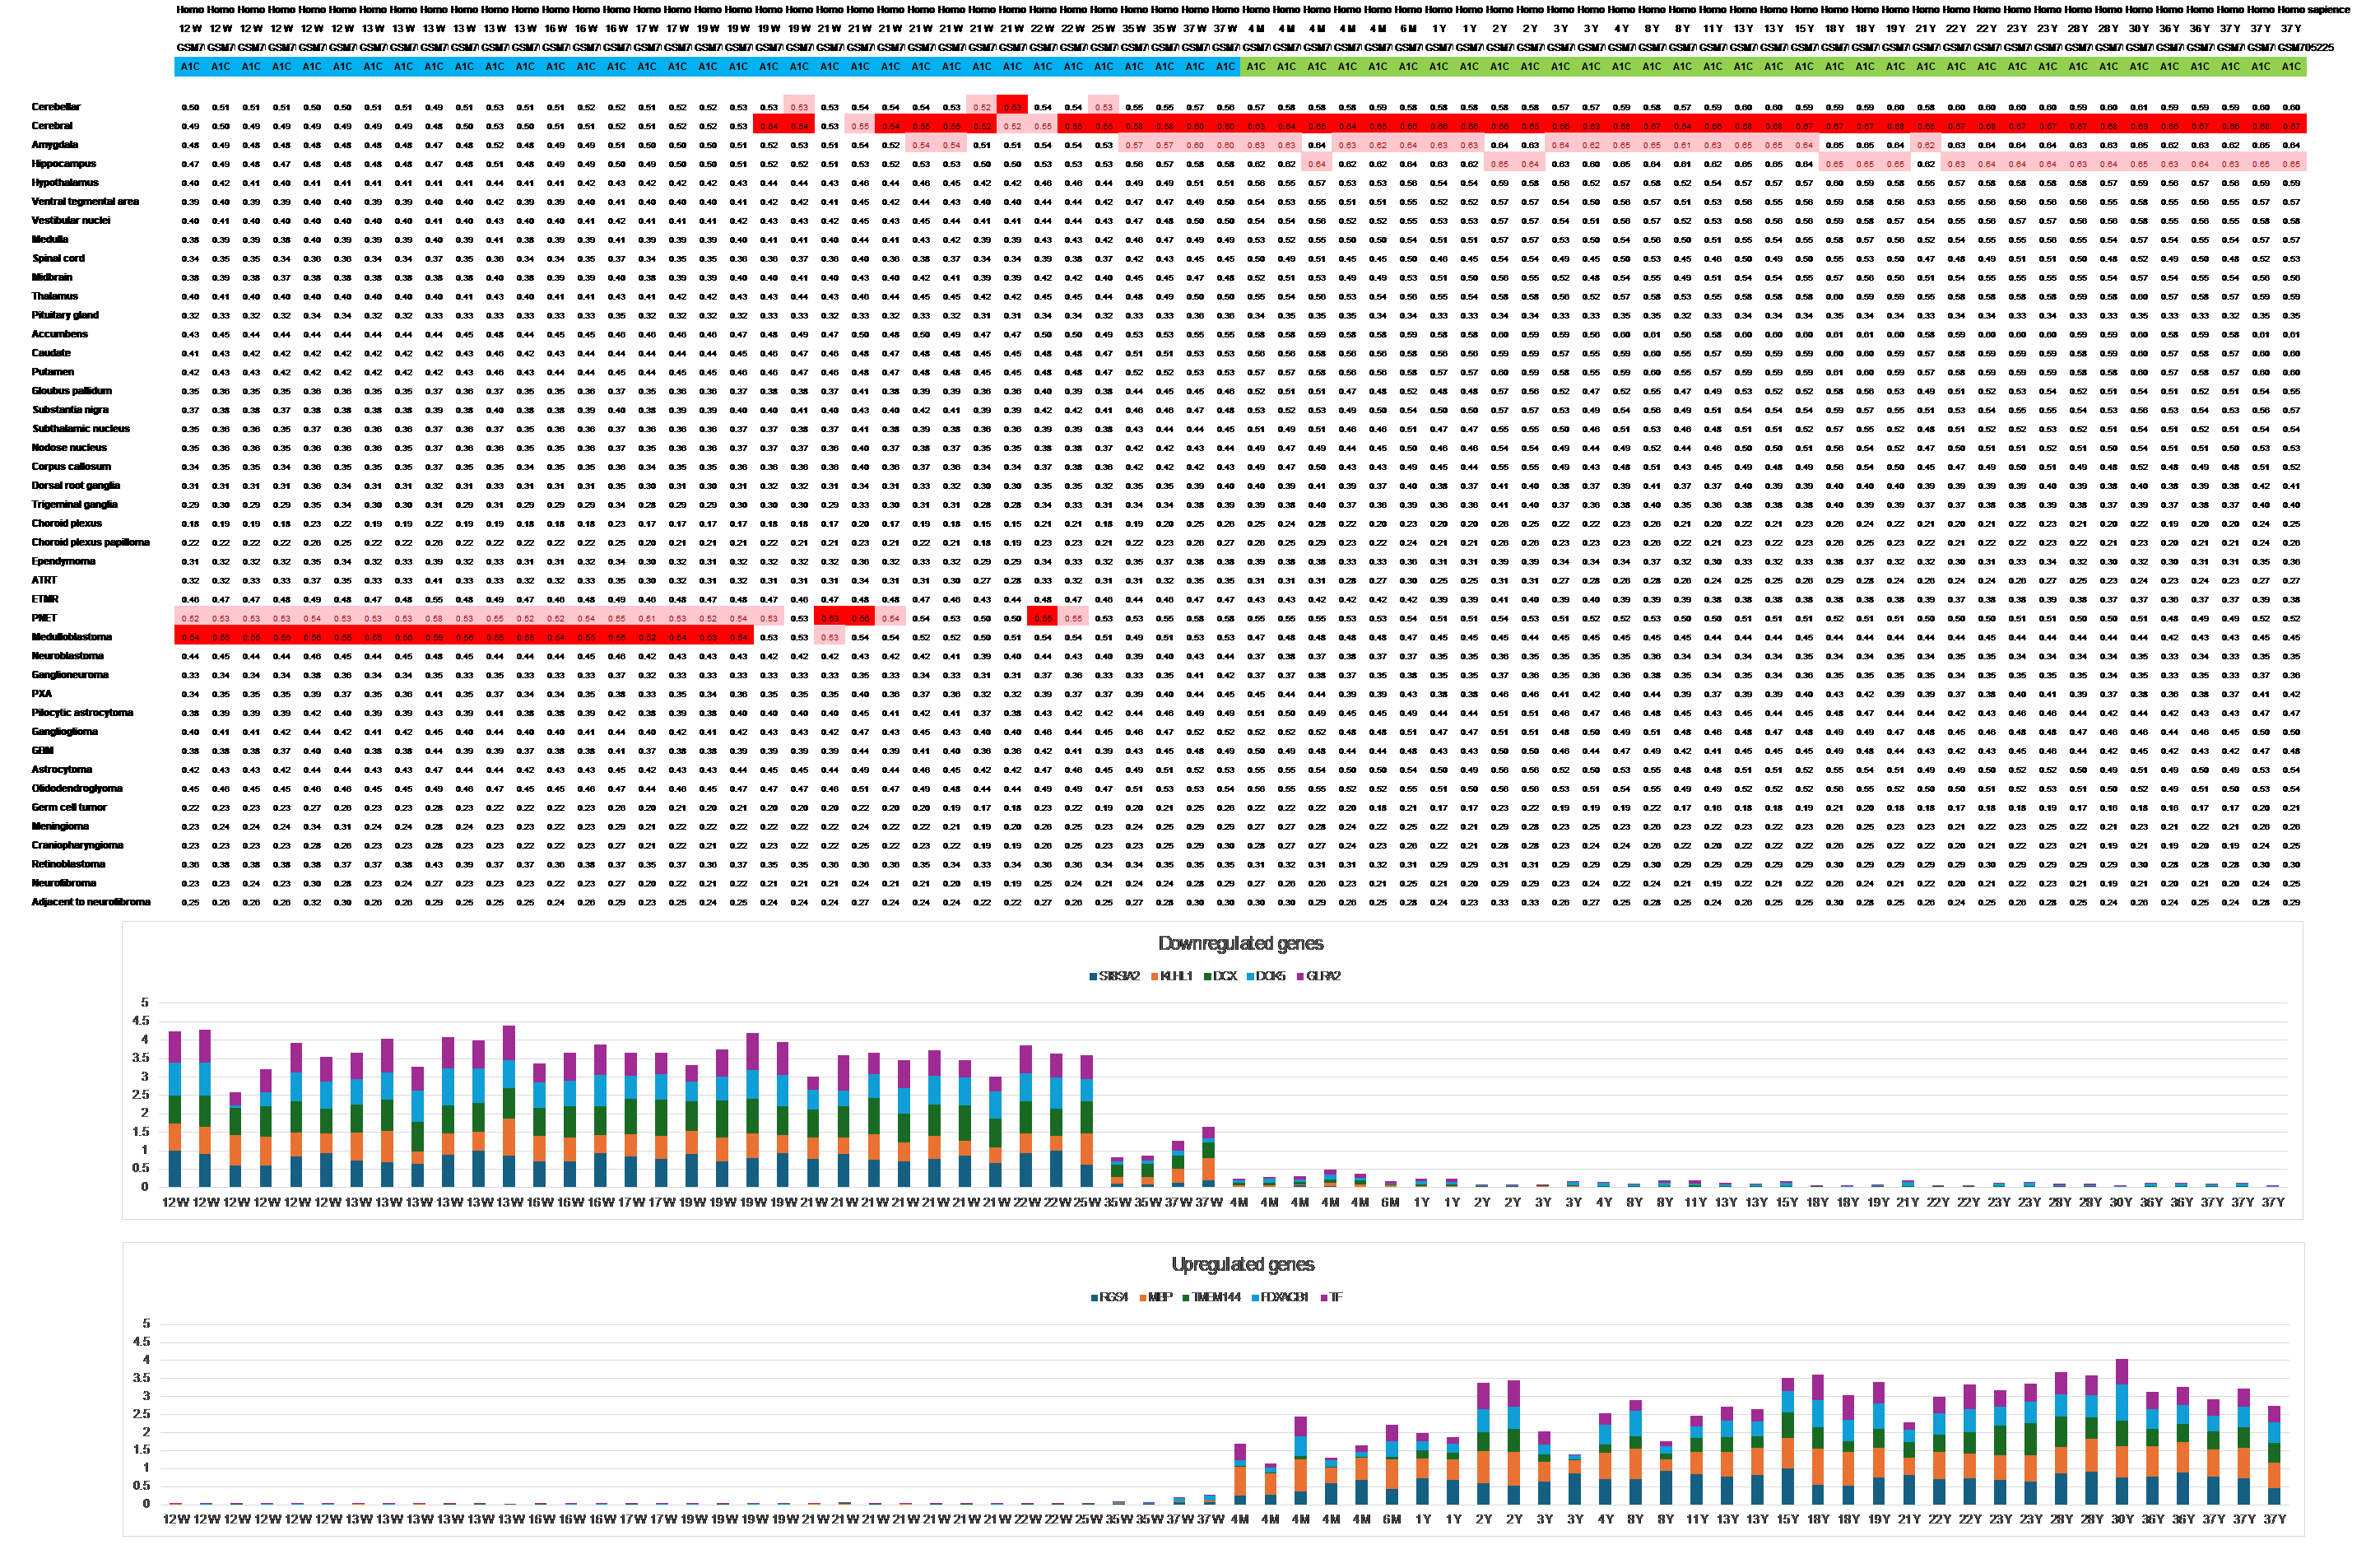
Figure 1: Dynamic Gene Expression Shift During Mid-Human Pregnancy
Figure 1: Dynamic Gene Expression Shift During Mid-Human Pregnancy
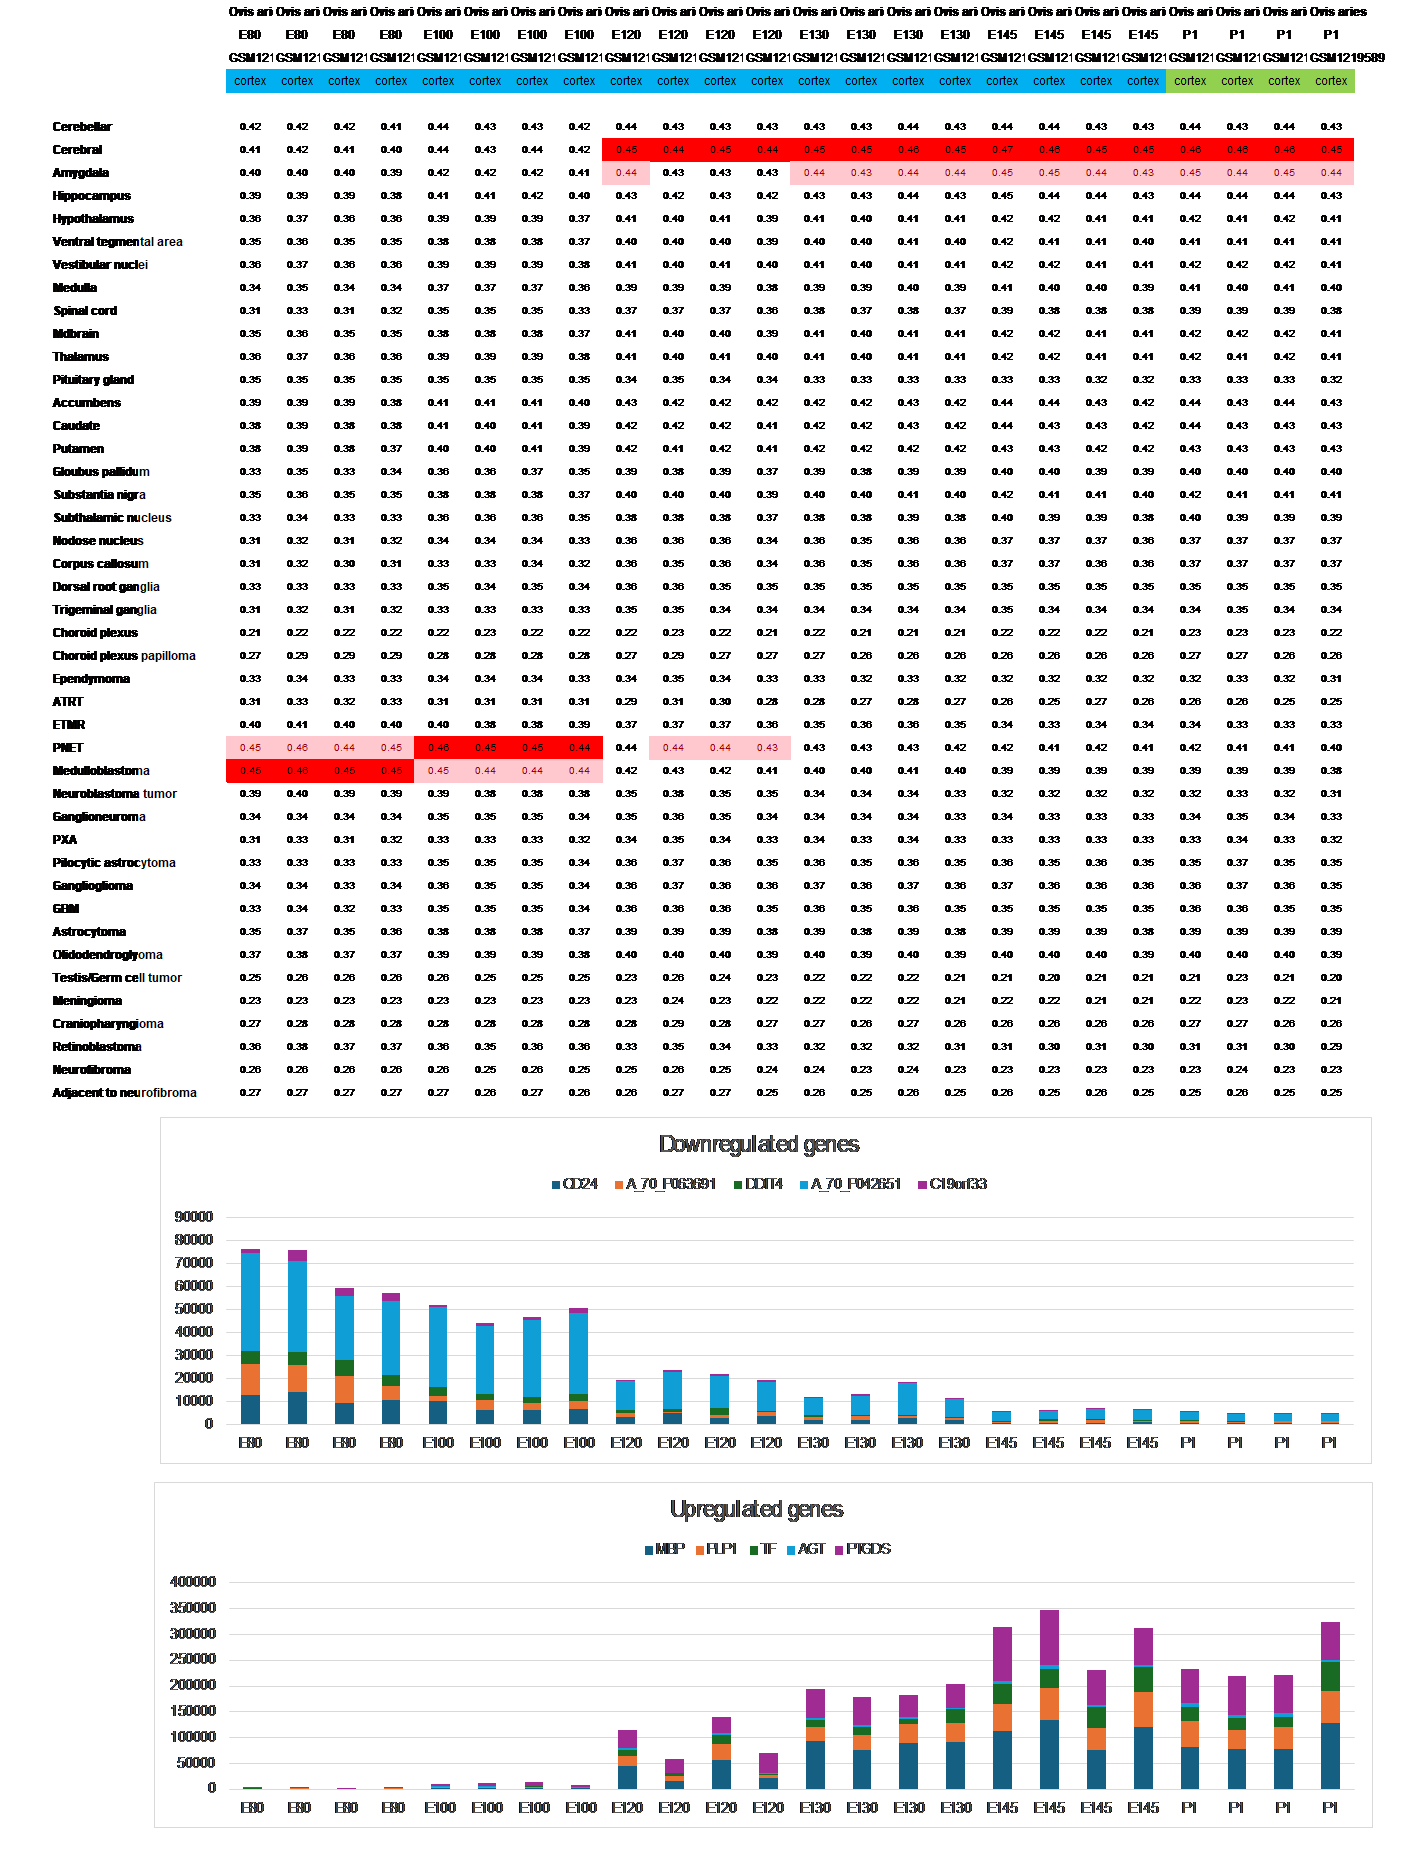
Figure 2: Transition from Primitive to Mature Expression Signature During Sheep Pregnancy
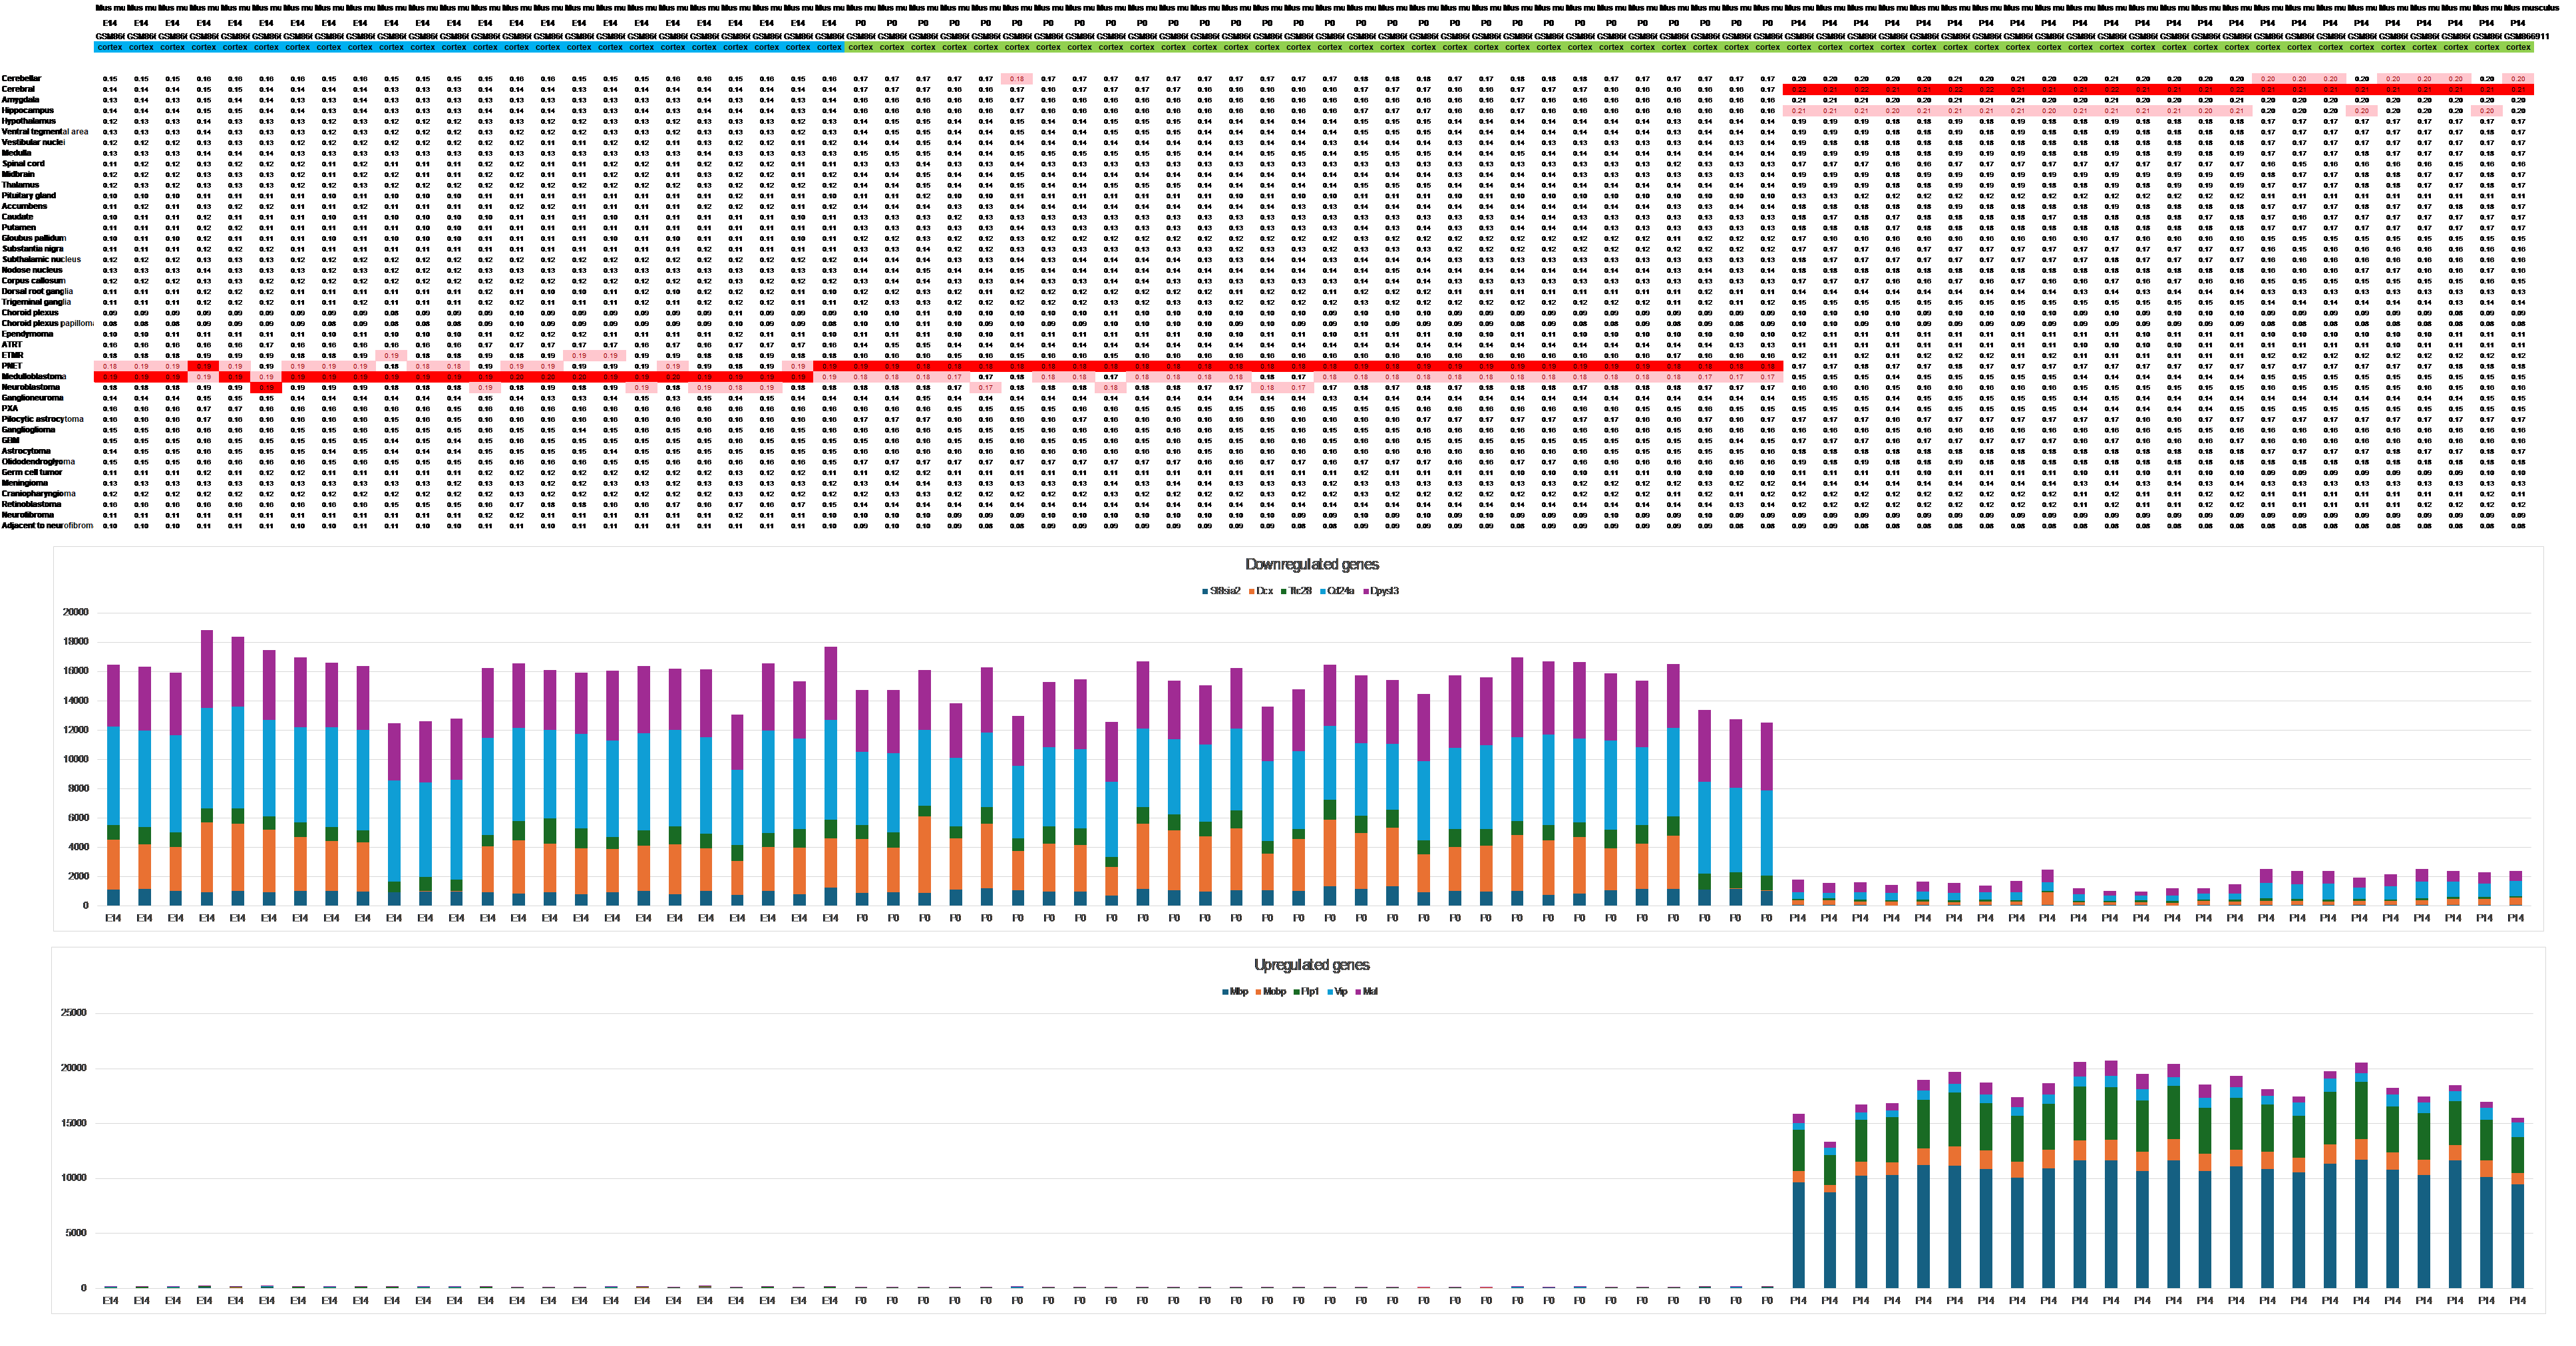
Figure 3: Transition from Primitive to Mature Expression Signature During the Mouse Neonatal Period
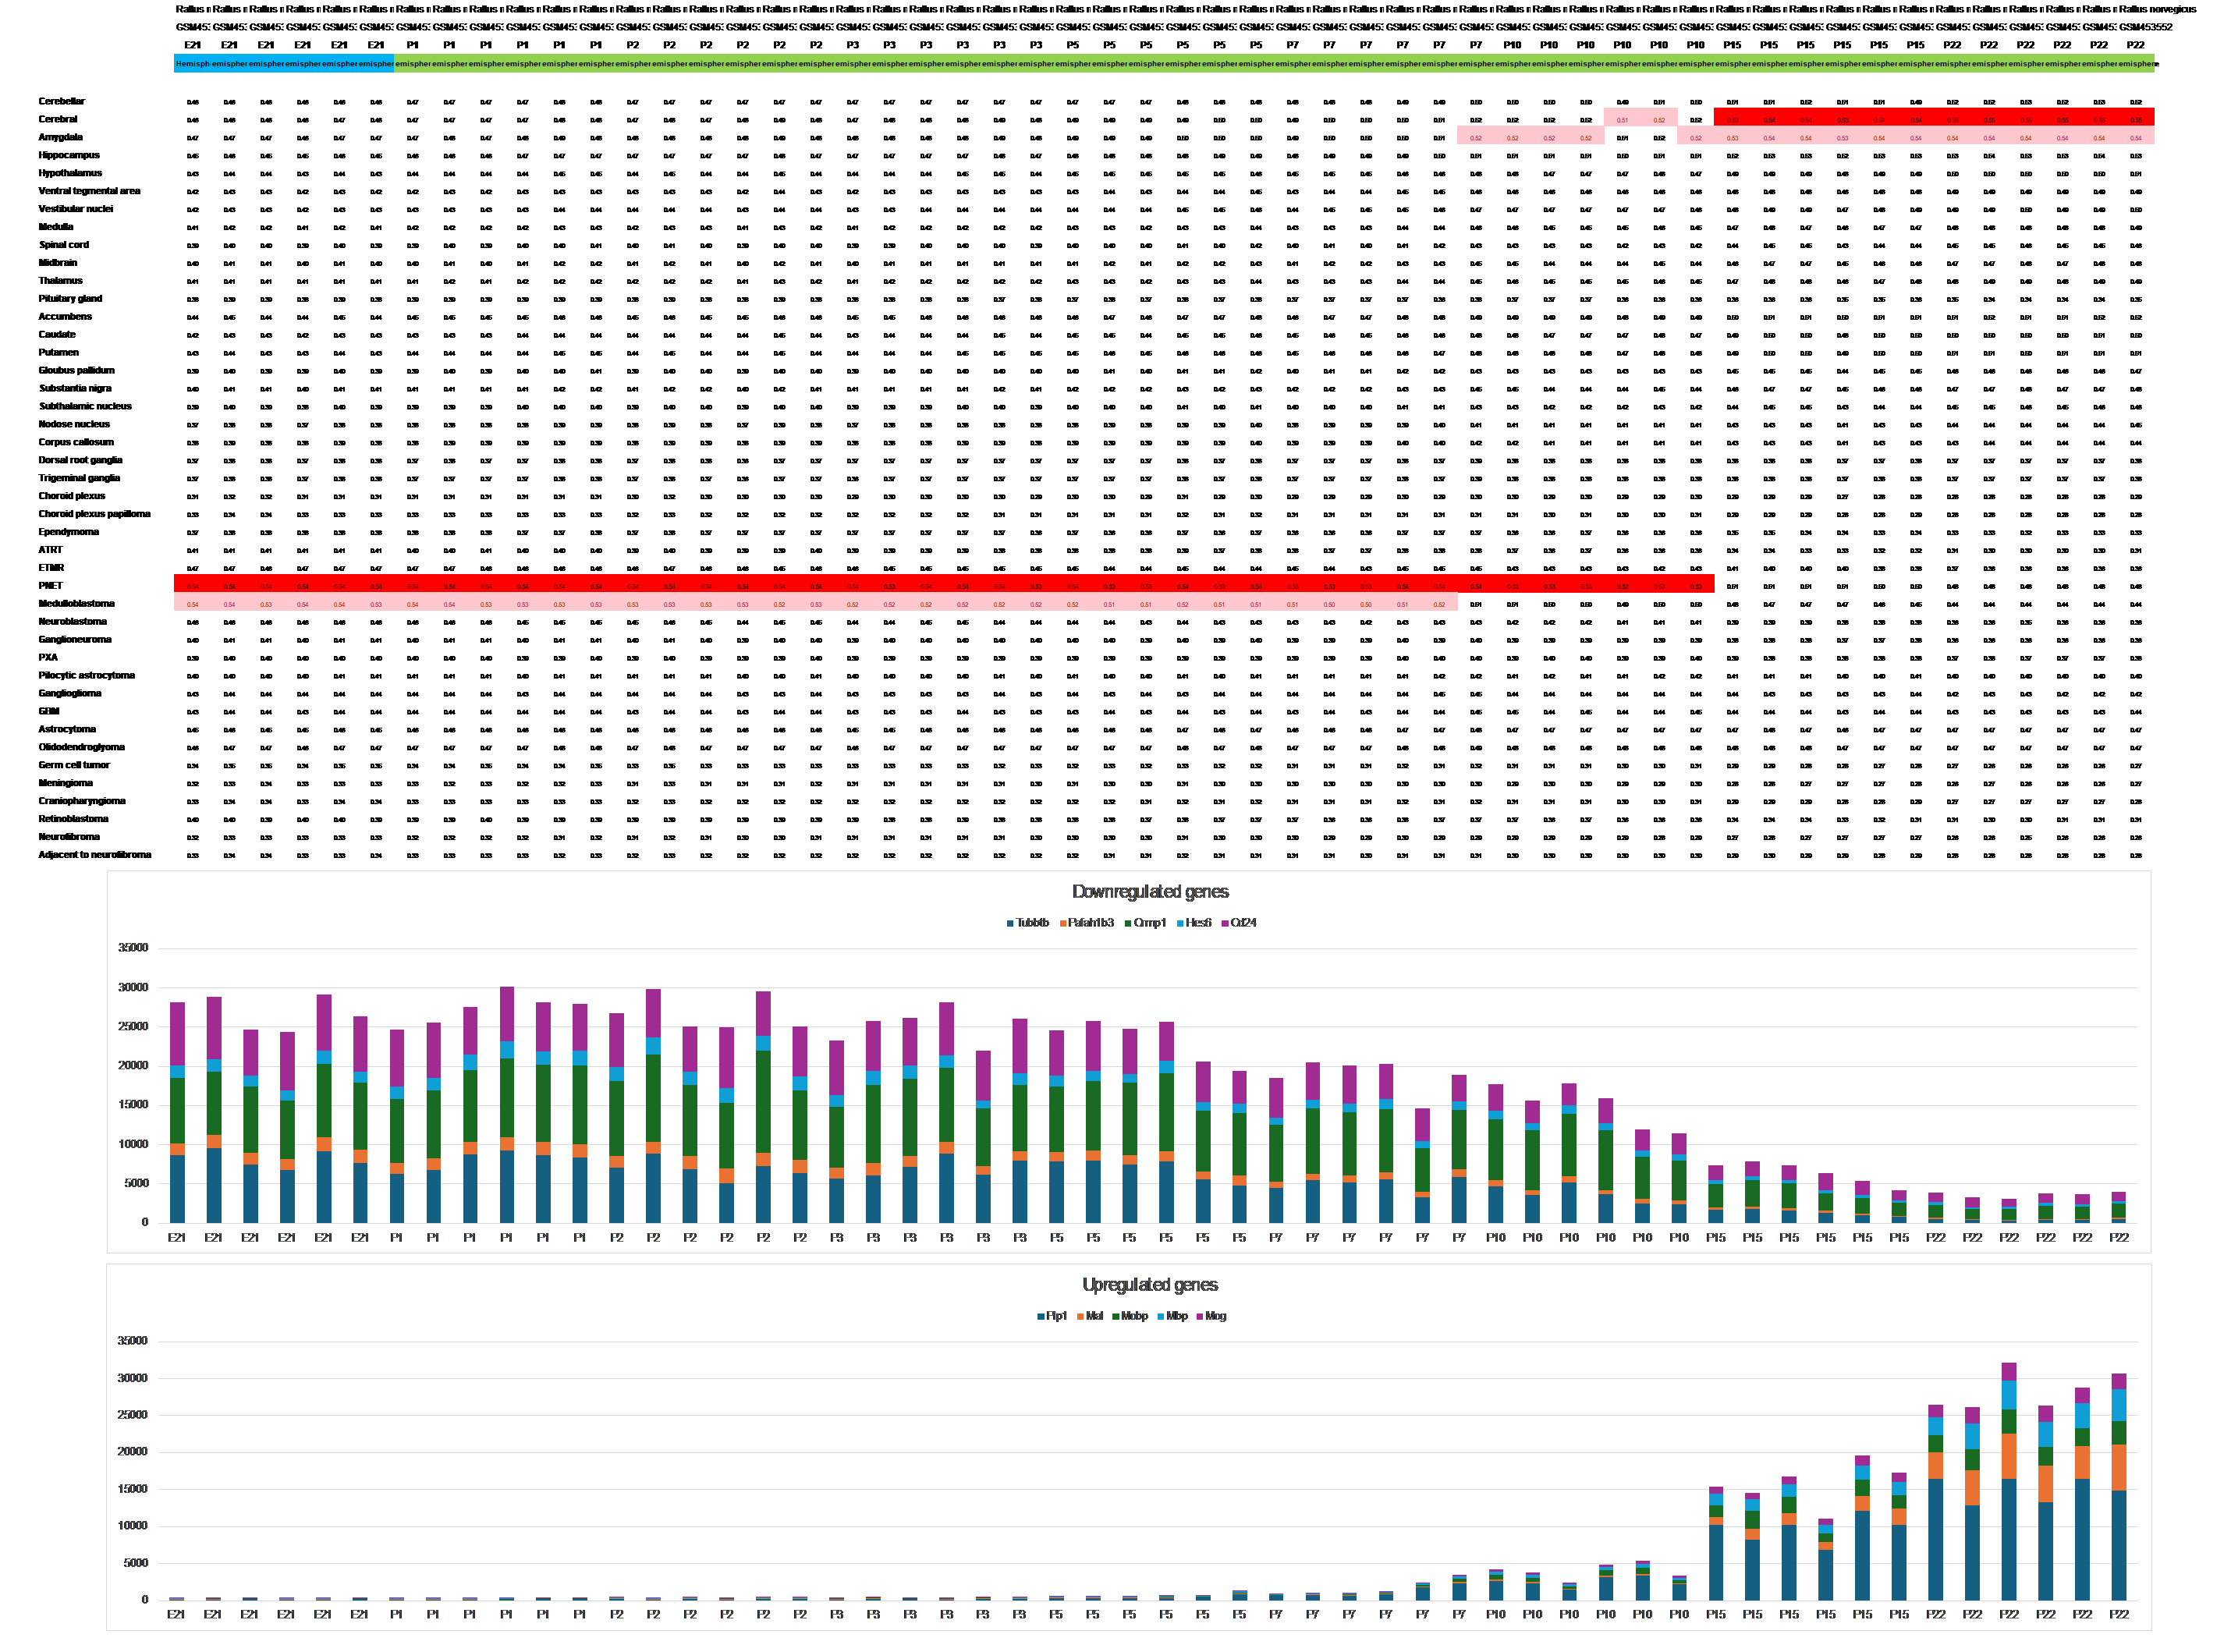
Figure 4: Transition from Primitive to Mature Expression Signature in the Rat Brain During the Neonatal Period

Figure 5: Upregulation of Cerebellar-Specific Genes during the Mouse Neonatal Period
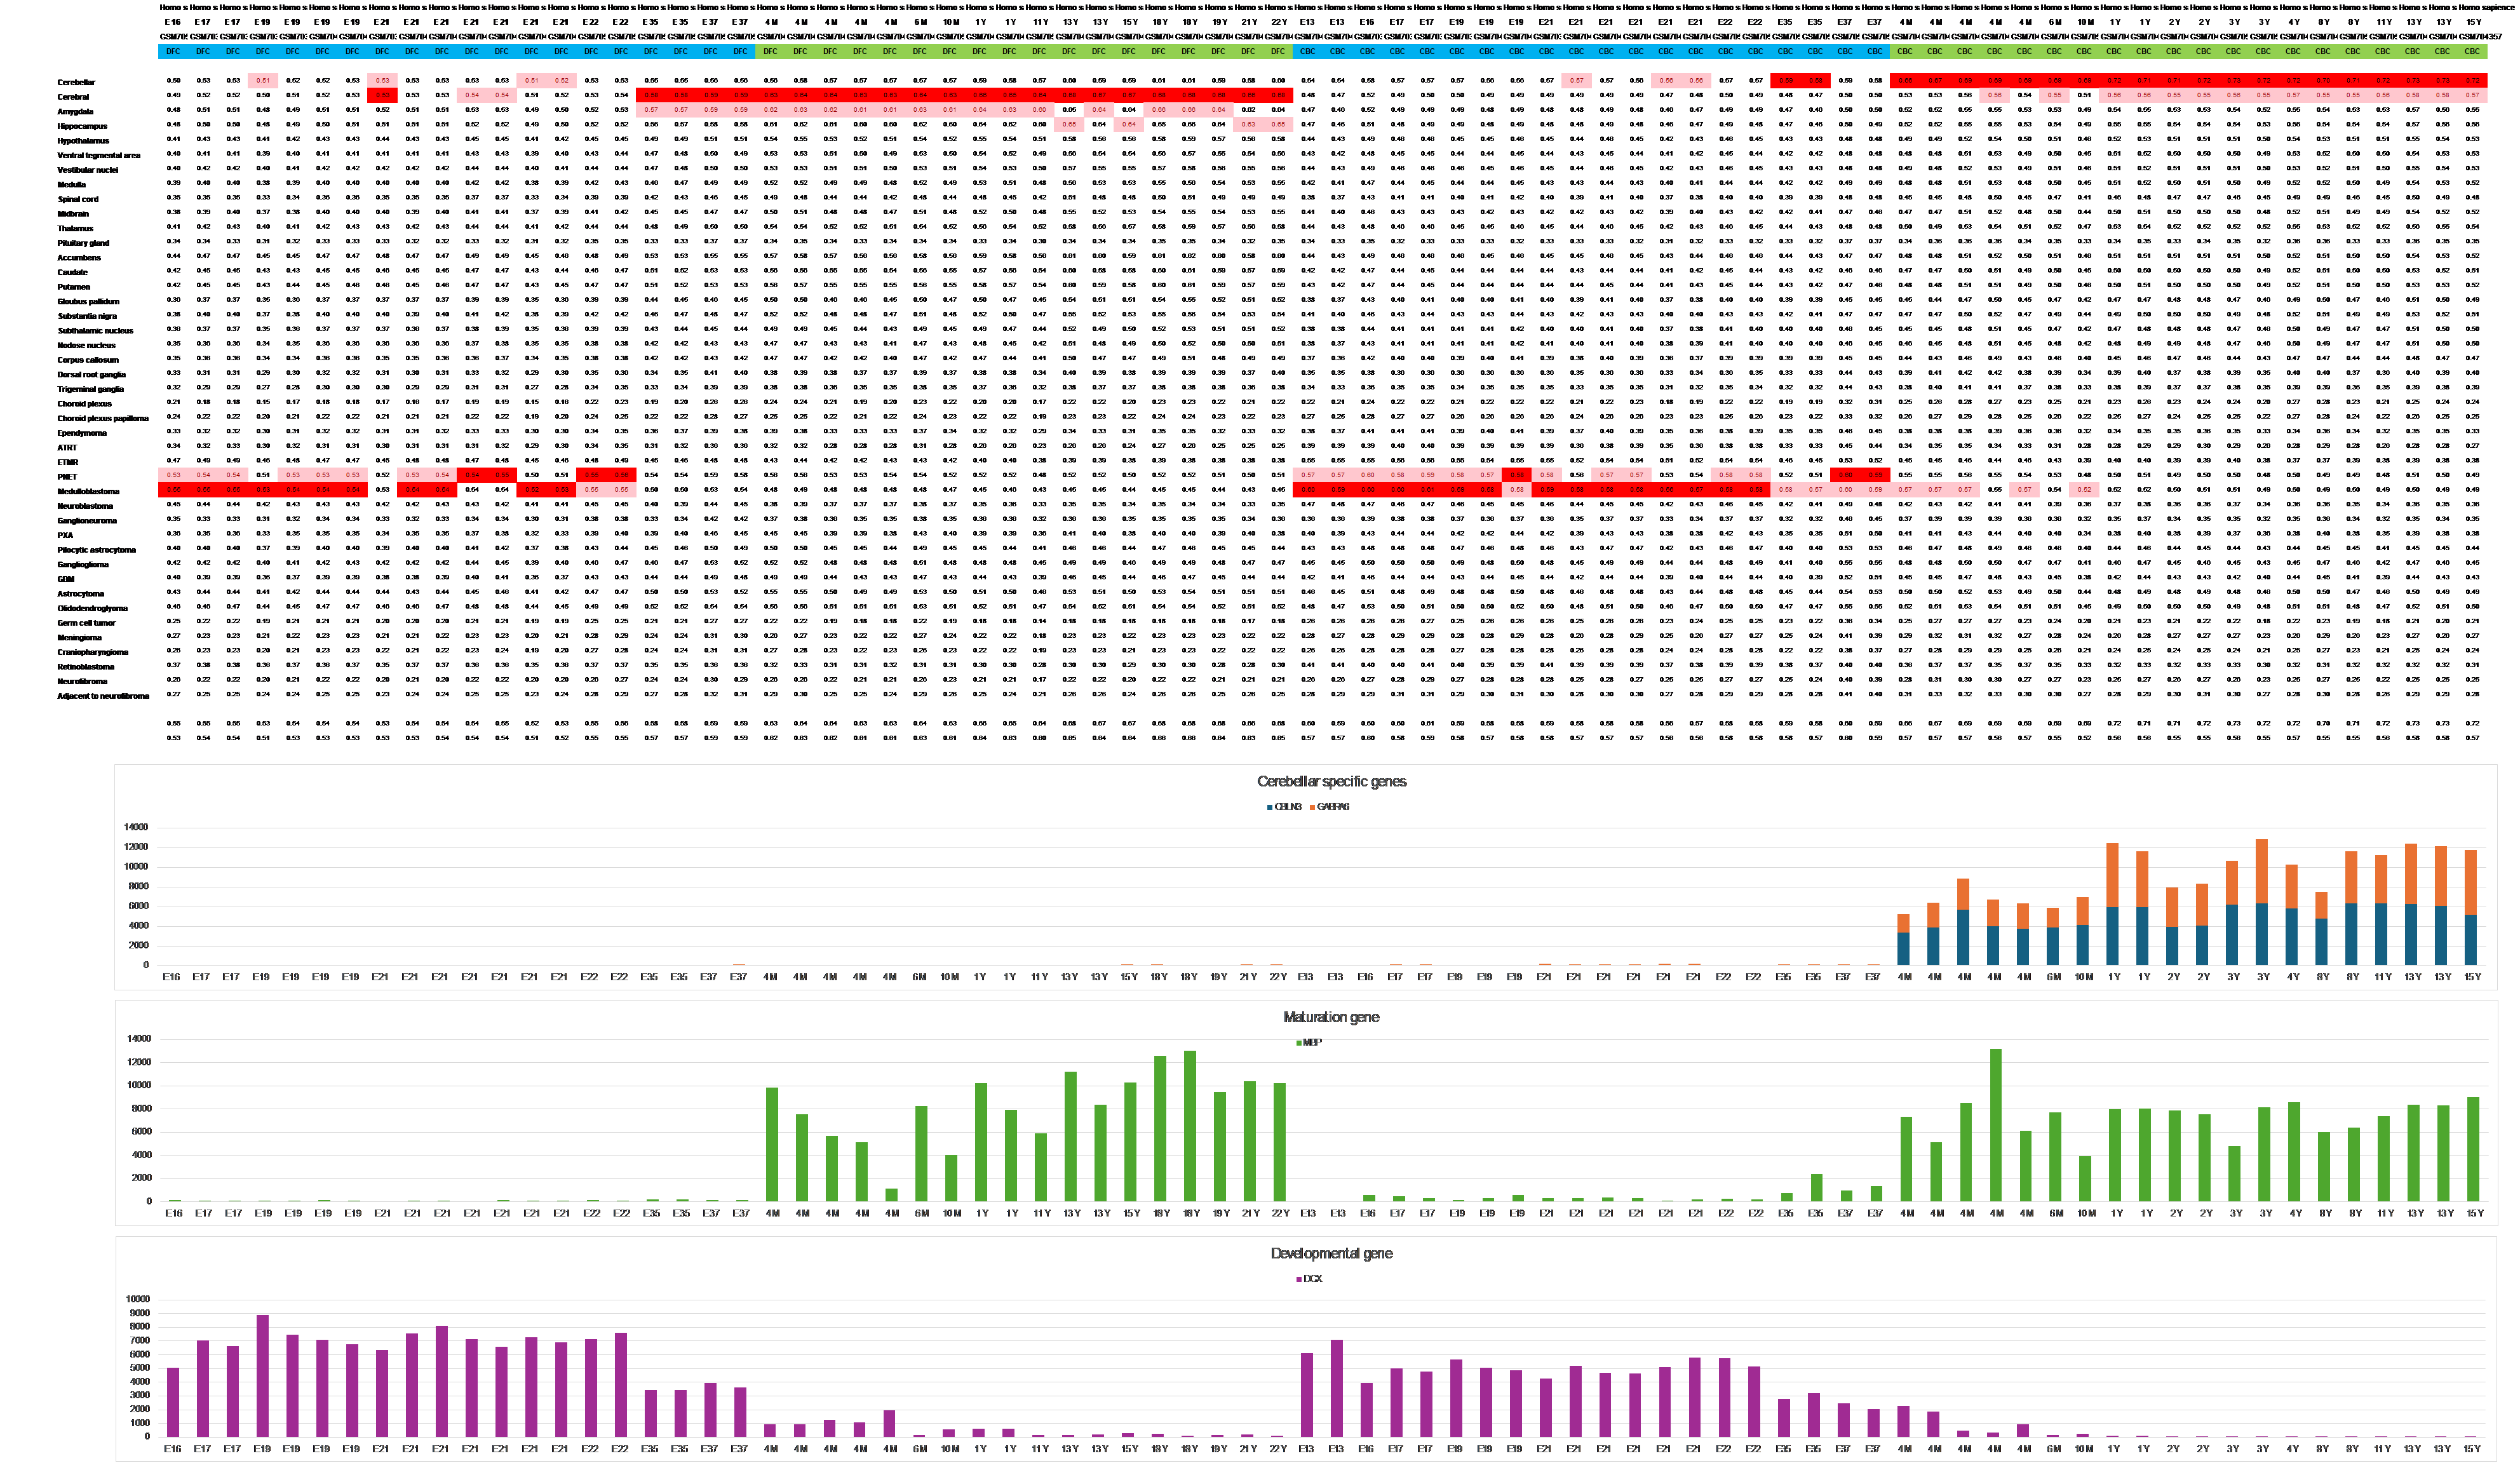
Figure 6: Upregulation of Cerebellar-Specific Genes in Humans
Tables at a glance
Figures at a glance