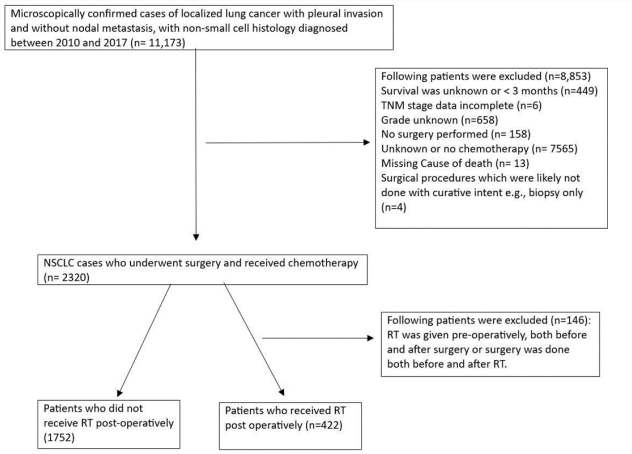
Figure 1: Flowchart demonstrating patient selection process
Clinicopathologic and demographic characteristics |
No RT |
RT |
p-value After matching |
No RT |
RT |
P-value Before matching |
Sex |
|
|
0.529 |
|
|
< 0.001 |
Female |
168 (39.8%) |
177 (41.9%) |
|
903 (51.5%) |
177 (41.9%) |
|
Male |
254 (60.2%) |
245 (58.1%) |
|
849 (48.5%) |
245 (58.1%) |
|
Age |
|
|
0.680 |
|
|
0.143 |
18-64 |
208 (49.3%) |
214 (50.7%) |
|
819 (46.7%) |
214 (50.7%) |
|
65+ |
214 (50.7%) |
208 (49.3%) |
|
933 (53.3%) |
208 (49.3%) |
|
Race |
|
|
0.789 |
|
|
0.256 |
Non-Hispanic Asian or Pacific Islander |
28 (6.6%) |
34 (8.1%) |
|
134 (7.6%) |
34 (8.1%) |
|
Non-Hispanic Black |
40 (9.5%) |
45 (10.7%) |
|
145 (8.3%) |
45 (10.7%) |
|
Non-Hispanic White |
334 (79.1%) |
324 (76.8%) |
|
1364 (77.9%) |
324 (76.8%) |
|
Other |
20 (4.7%) |
19 (4.5%) |
|
109 (6.2%) |
19 (4.5%) |
|
Histologic Grade |
|
|
0.673 |
|
|
< 0.001 |
Grade I-II |
165 (39.1%) |
171 (40.5%) |
|
925 (52.8%) |
171 (40.5%) |
|
Grade III-IV |
257 (60.9%) |
251 (59.5%) |
|
827 (47.2%) |
251 (59.5%) |
|
Marital status at diagnosis |
|
|
0.435 |
|
|
0.061 |
Married |
256 (60.7%) |
267 (63.3%) |
|
1021 (58.3%) |
267 (63.3%) |
|
Not married/ divorced/ widowed |
166 (39.3%) |
155 (36.7%) |
|
731 (41.7%) |
155 (36.7%) |
|
Pleural Invasion |
|
|
0.575 |
|
|
< 0.001 |
Visceral pleura invasion |
104 (24.6%) |
116 (27.5%) |
|
819 (46.7%) |
116 (27.5%) |
|
Parietal pleura invasion |
153 (36.3%) |
153 (36.3%) |
|
190 (10.8%) |
153 (36.3%) |
|
Tumor extends to pleura unspecified if visceral or parietal |
165 (39.1%) |
153 (36.3%) |
|
743 (42.4%) |
153 (36.3%) |
|
Size and extent of primary tumor “T” |
|
|
0.288 |
|
|
< 0.001 |
T2 |
113 (26.8%) |
111 (26.3%) |
|
994 (56.7%) |
111 (26.3%) |
|
T3 |
264 (62.6%) |
251 (59.5%) |
|
632 (36.1%) |
251 (59.5%) |
|
T4 |
45 (10.7%) |
60 (14.2%) |
|
126 (7.2%) |
60 (14.2%) |
|
Tumor Histology |
|
|
0.559 |
|
|
< 0.001 |
Adenocarcinoma |
226 (53.6%) |
236 (55.9%) |
|
1230 (70.2%) |
236 (55.9%) |
|
SCC |
173 (41.0%) |
169 (40.0%) |
|
468 (26.7%) |
169 (40.0%) |
|
Other histology |
23 (5.5%) |
17 (4.0%) |
|
54 (3.1%) |
17 (4.0%) |
|
Table 1: Patient characteristics: before and after matching
Clinical and demographic characteristics |
Value |
5 year CSS |
p.value Univariate analysis |
aHR |
p.value Multivariate analysis |
Age |
18-64 |
0.63 |
(ref) |
(ref) |
(ref) |
|
65+ |
0.55 (0.5-0.6) |
0.009* |
1.32 |
0.012* |
|
(1.06-1.63) |
||||
Sex |
Female |
0.63 |
(ref) |
(ref) |
(ref) |
|
Male |
0.56 |
0.004* |
1.33 |
0.012* |
|
(0.52-0.61) |
(1.06-1.66) |
|||
Race |
Non-Hispanic Asian or Pacific Islander |
0.52 |
(ref) |
(ref) |
(ref) |
|
Non-Hispanic Black |
0.64 |
0.273 |
0.79 |
0.373 |
|
(0.54-0.76) |
(0.48-1.32) |
|||
|
Non-Hispanic White |
0.59 |
0.321 |
0.82 |
0.314 |
|
(0.55-0.63) |
(0.56-1.21) |
|||
|
Other |
0.64 |
0.232 |
0.69 |
0.273 |
|
(0.49-0.83) |
(0.36-1.34) |
|||
Histologic |
I-II |
0.63 |
(ref) |
(ref) |
(ref) |
Grade |
(0.58-0.69) |
||||
|
III-IV |
0.56 |
0.078 |
1.16 |
0.211 |
|
(0.52-0.61) |
(0.92-1.45) |
|||
Size and extent |
T2 |
0.66 |
(ref) |
(ref) |
(ref) |
of Tumor |
(0.6-0.73) |
||||
|
T3 |
0.57 |
0.004* |
1.48 |
0.008* |
|
(0.52-0.61) |
(1.11-1.98) |
|||
|
T4 |
0.55 |
0.011* |
1.55 |
0.021* |
(0.45-0.66) |
(1.07-2.25) |
||||
Marital status |
Married |
0.58 |
(ref) |
(ref) |
(ref) |
at diagnosis |
(0.53-0.63) |
||||
|
Not married- |
0.61 |
0.458 |
0.98 |
0.887 |
|
divorced- widowed |
(0.56-0.67) |
(0.79-1.23) |
||
Pleural |
Visceral Pleural |
0.6 |
(ref) |
(ref) |
(ref) |
Invasion |
Invasion (PL1/PL2) |
(0.53-0.67) |
|||
|
Parietal Pleura |
0.58 |
0.787 |
0.81 |
0.162 |
|
invasion (PL3) |
(0.53-0.65) |
(0.6-1.09) |
||
|
Tumor extends to pleura unspecified if visceral or parietal |
0.59 |
0.701 |
0.88 |
0.372 |
Tumor |
Adenocarcinoma |
0.62 |
(ref) |
(ref) |
(ref) |
Histology |
(0.57-0.67) |
||||
|
SCC |
0.56 |
0.064 |
1.16 |
0.204 |
|
(0.5-0.62) |
(0.92-1.45) |
|||
|
Other |
0.55 |
0.143 |
1.54 |
0.071 |
|
(0.41-0.74) |
(0.96-2.46) |
Table 2: Univariate and multivariate analyses of the CSS rate after PSM
Clinical and demographic characteristics |
Value |
5 year OS |
p.value Univariate |
aHR |
p.value Multiv |
Age |
18-64 |
0.56 |
(ref) |
(ref) |
(ref) |
65+ |
0.42 |
<0.001*** |
1.45 |
<0.001*** |
|
Sex |
Female |
0.55 (0.5-0.61) |
(ref) |
(ref) |
(ref) |
Male |
0.46 (0.41-0.5) |
<0.001*** |
1.39 |
<0.001*** |
|
Race |
Non-Hispanic Asian or Pacific Islander |
0.47 |
(ref) |
(ref) |
(ref) |
Non-Hispanic Black |
0.58 (0.48-0.7) |
0.471 |
0.92 |
0.736 |
|
Non-Hispanic White |
0.49 |
0.926 |
1.01 |
0.966 |
|
Other |
0.46 |
0.902 |
1.06 |
0.835 |
|
Histologic grade |
I-II |
0.55 (0.5-0.61) |
(ref) |
(ref) |
(ref) |
|
III-IV |
0.46 |
0.043* |
1.18 |
0.1 |
Size and extent of Tumor |
T2 |
0.57 |
(ref) |
(ref) |
(ref) |
T3 |
0.48 |
0.009* |
1.33 |
0.028* |
|
T4 |
0.4 (0.31-0.51) |
<0.001*** |
1.63 |
0.002* |
|
Marital status at diagnosis |
Married |
0.48 |
(ref) |
(ref) |
(ref) |
Not married/ divorced/ widowed |
0.51 |
0.353 |
0.98 |
0.84 |
|
Pleural Invasion |
Viseral Pleural Invasion (PL1/PL2) |
0.53 (0.47-0.6) |
(ref) |
(ref) |
(ref) |
Parietal Pleura invasion (PL3) |
0.48 |
0.506 |
0.87 |
0.29 |
|
Tumor extends to pleura unspecified if visceral or parietal |
0.48 |
0.514 |
0.98 |
0.892 |
|
Tumor Histology |
Adenocarcinoma |
0.54 |
(ref) |
(ref) |
(ref) |
SCC |
0.43 |
0.002* |
1.24 |
0.028* |
|
Other |
0.51 (0.38-0.7) |
0.307 |
1.36 |
0.166 |
Table 3: Univariate and multivariate analyses of the OS rate after PSM
Clinical and demographic characteristics |
Value |
No RT |
RT |
p.value |
aHR |
p.valuemultiv |
Age |
18-64 |
0.64 |
0.49 (0.43- |
<0.001*** |
1.73 |
<0.001*** |
(0.57-0.71) |
(1.3-2.31) |
|||||
|
|
|
0.56) |
|
|
|
|
65+ |
0.49 |
0.36 (0.3- |
0.002* |
1.52 |
<0.001*** |
(0.42-0.57) |
(1.19-1.95) |
|||||
|
|
|
0.44) |
|
|
|
Race |
Non-Hispanic |
0.54 |
0.4 (0.27- |
0.108 |
2.08 |
0.055 |
Asian |
(0.37-0.8) |
(0.99-4.4) |
||||
|
or Pacific Islander |
|
0.61) |
|
|
|
|
Non-Hispanic |
0.59 |
0.57 |
0.55 |
1.31 |
0.429 |
Black |
(0.46-0.77) |
(0.45-0.74) |
(0.67-2.56) |
|||
Non-Hispanic |
0.56 |
0.41 |
<0.001*** |
1.61 |
<0.001*** |
|
White |
(0.51-0.62) |
(0.36-0.47) |
(1.31-1.99) |
|||
Other |
0.53 |
0.38 |
0.295 |
1.61 |
0.324 |
|
(0.35-0.81) |
(0.21-0.7) |
(0.62-4.16) |
||||
Sex |
Female |
0.61 |
0.5 |
0.004* |
1.58 |
0.004* |
(0.53-0.69) |
(0.43-0.58) |
(1.16-2.17) |
||||
|
Male |
0.53 |
0.38 |
<0.001*** |
1.6 |
<0.001*** |
Size and extent of tumor |
T2 |
0.69 |
0.46 |
<0.001*** |
2.29 |
<0.001*** |
T3 |
0.53 |
0.43 |
0.004* |
1.52 |
<0.001*** |
|
T4 |
0.43 |
0.38 |
0.308 |
1.11 |
0.687 |
|
Histologic Grade |
I-II |
0.63 |
0.47 |
<0.001*** |
1.78 |
<0.001*** |
III-IV |
0.52 |
0.4 |
0.001* |
1.5 |
<0.001*** |
|
Tumor Histology |
Adenocarcinoma |
0.6 |
0.47 |
<0.001*** |
1.66 |
<0.001*** |
SCC |
0.5 |
0.37 |
0.009* |
1.52 |
0.004* |
|
Other |
0.65 (0.60 |
0.41 |
0.159 |
2.24 |
0.085 |
|
Marital status at diagnosis |
Married |
0.56 |
0.42 |
<0.001*** |
1.62 |
<0.001*** |
Not married- divorced- widowed |
0.57 |
0.45 |
0.011* |
1.56 |
0.005* |
|
Visceral Parietal Invasion |
Visceral Pleural Invasion (PL1/PL2) |
0.65 |
0.43 |
<0.001*** |
2.15 |
<0.001*** |
Parietal Pleural Invasion (PL3) |
0.54 |
0.43 |
0.038* |
1.45 |
0.019* |
|
Tumor extends to pleura unspecified if visceral or parietal |
0.53 |
0.43 |
0.01* |
1.52 |
0.006* |
Table 4: 5y OS rate in RT/no RT group
Clinical and demographic characteristics |
Value |
No RT |
RT Group |
p.value |
aHR |
p.value multivariate |
Age |
18-64 |
0.7 |
0.56 (0.49- |
<0.001*** |
1.78 (1.29- |
<0.001*** |
|
|
|
0.63) |
|
2.45) |
|
|
65+ |
0.59 |
0.51 (0.44- |
0.067 |
1.35 (1.01- |
0.042* |
|
|
|
0.59) |
|
1.81) |
|
Sex |
Female |
0.66 |
0.6 |
0.081 |
1.34 |
0.103 |
Male |
0.63 |
0.49 |
0.001* |
1.6 |
<0.001*** |
|
Race |
Non-Hispanic Asian or Pacific Islander |
0.64 |
0.42 |
0.063 |
2.28 |
0.045* |
Non-Hispanic Black |
0.68 |
0.61 |
0.417 |
1.7 |
0.17 |
|
Non-Hispanic White |
0.64 |
0.53 |
0.002* |
1.49 |
0.001* |
|
Other |
0.64 |
0.63 |
0.872 |
2.13 |
0.267 |
|
Size and extent of Tumor |
T2 |
0.75 |
0.57 |
0.002* |
2.11 |
0.002* |
T3 |
0.6 |
0.53 |
0.032* |
1.42 |
0.01* |
|
T4 |
0.59 |
0.52 |
0.296 |
1.39 |
0.313 |
|
Histologic Grade |
I-II |
0.68 |
0.58 |
0.018* |
1.56 |
0.015* |
III-IV |
0.62 |
0.51 |
0.006* |
1.48 |
0.004* |
|
Histology |
Adenocarcinoma |
0.68 |
0.56 |
0.003* |
1.59 |
0.002* |
SCC |
0.6 |
0.51 |
0.067 |
1.46 |
0.026* |
|
|
Other |
0.65 (0.60 - |
0.49 |
0.266 |
1.94 |
0.189 |
Marital status at diagnosis |
Married |
0.62 |
0.53 |
0.009* |
1.47 |
0.005* |
Not married/ divorced/ widowed |
0.67 |
0.55 |
0.015* |
1.64 |
0.007* |
|
Pleural Invasion |
Viseral Pleural Invasion (PL1/PL2) |
0.69 |
0.52 |
0.006* |
1.87 |
0.005* |
Parietal Pleura invasion (PL3) |
0.64 |
0.52 |
0.046* |
1.5 |
0.027* |
|
Tumor extends to pleura unspecified if visceral or parietal |
0.62 |
0.57 |
0.122 |
1.44 |
0.044* |
Supplementary Table 1: 5y CSS rate in RT/no RT group
Figure 1: Flowchart demonstrating patient selection process
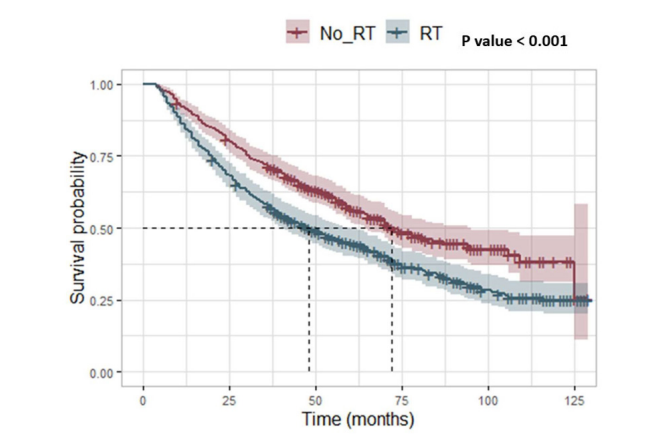
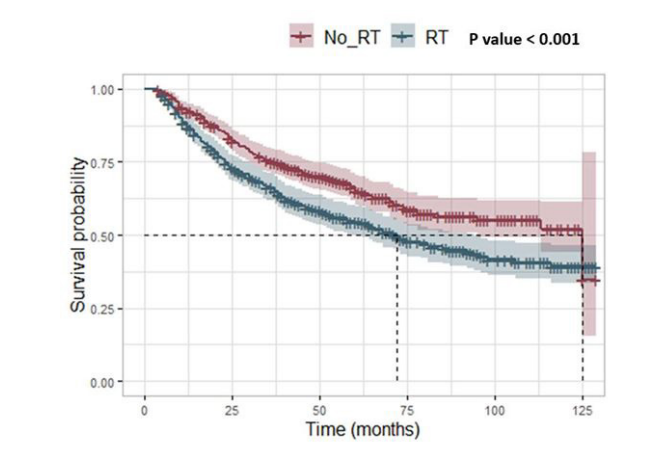
Figure 2: Kaplan Meier curve for Overall survival
Supplementary Figure 1: Kaplan Meier Curve for Cancer-specific survival: Similar to overall survival, RT was associated with worse CSS compared to the non-RT group
Tables at a glance
Figures at a glance