Table 1: Baseline patient characteristics
Table 2
Table 3: Post-treatment tumour characteristics
Table 4: Distribution of pathological composite stage among study population
Table 5
Table 6: Effect of tumour-related characteristics on survival outcome
Table 7: Univariate Cox regression for OS
Table 8
Table 9: Univariate Cox regression for DFS
Table 10: Multivariate Cox regression for OS
Table 11: Multivariate Cox regression for DFS
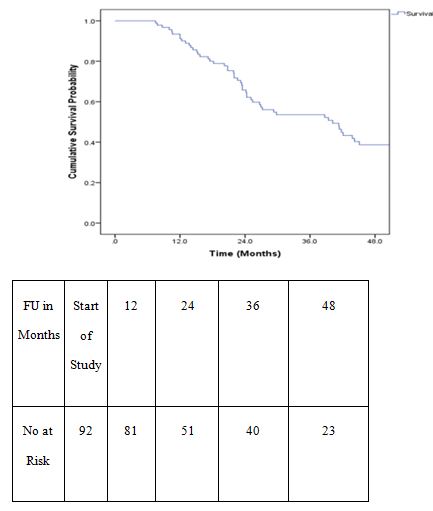
Chart No 1: Kaplan Meier plot of OS
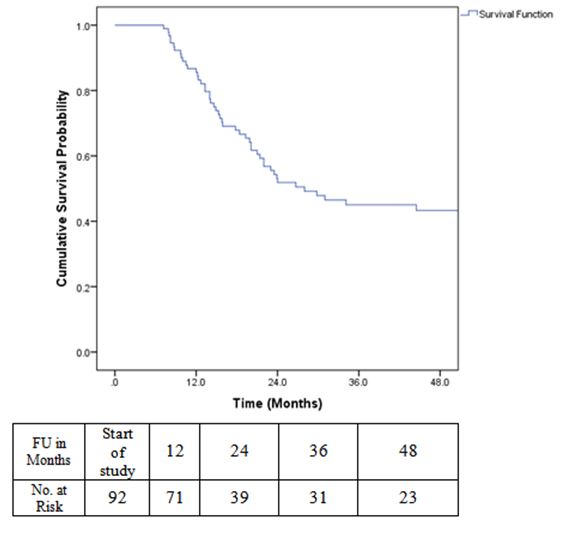
Chart No 2: Kaplan Meier plot of DFS
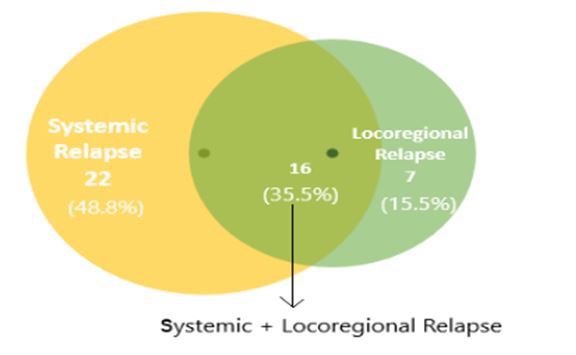
Figure 3: Venn diagram showing the pattern of relapse
Tables at a glance
Figures at a glance