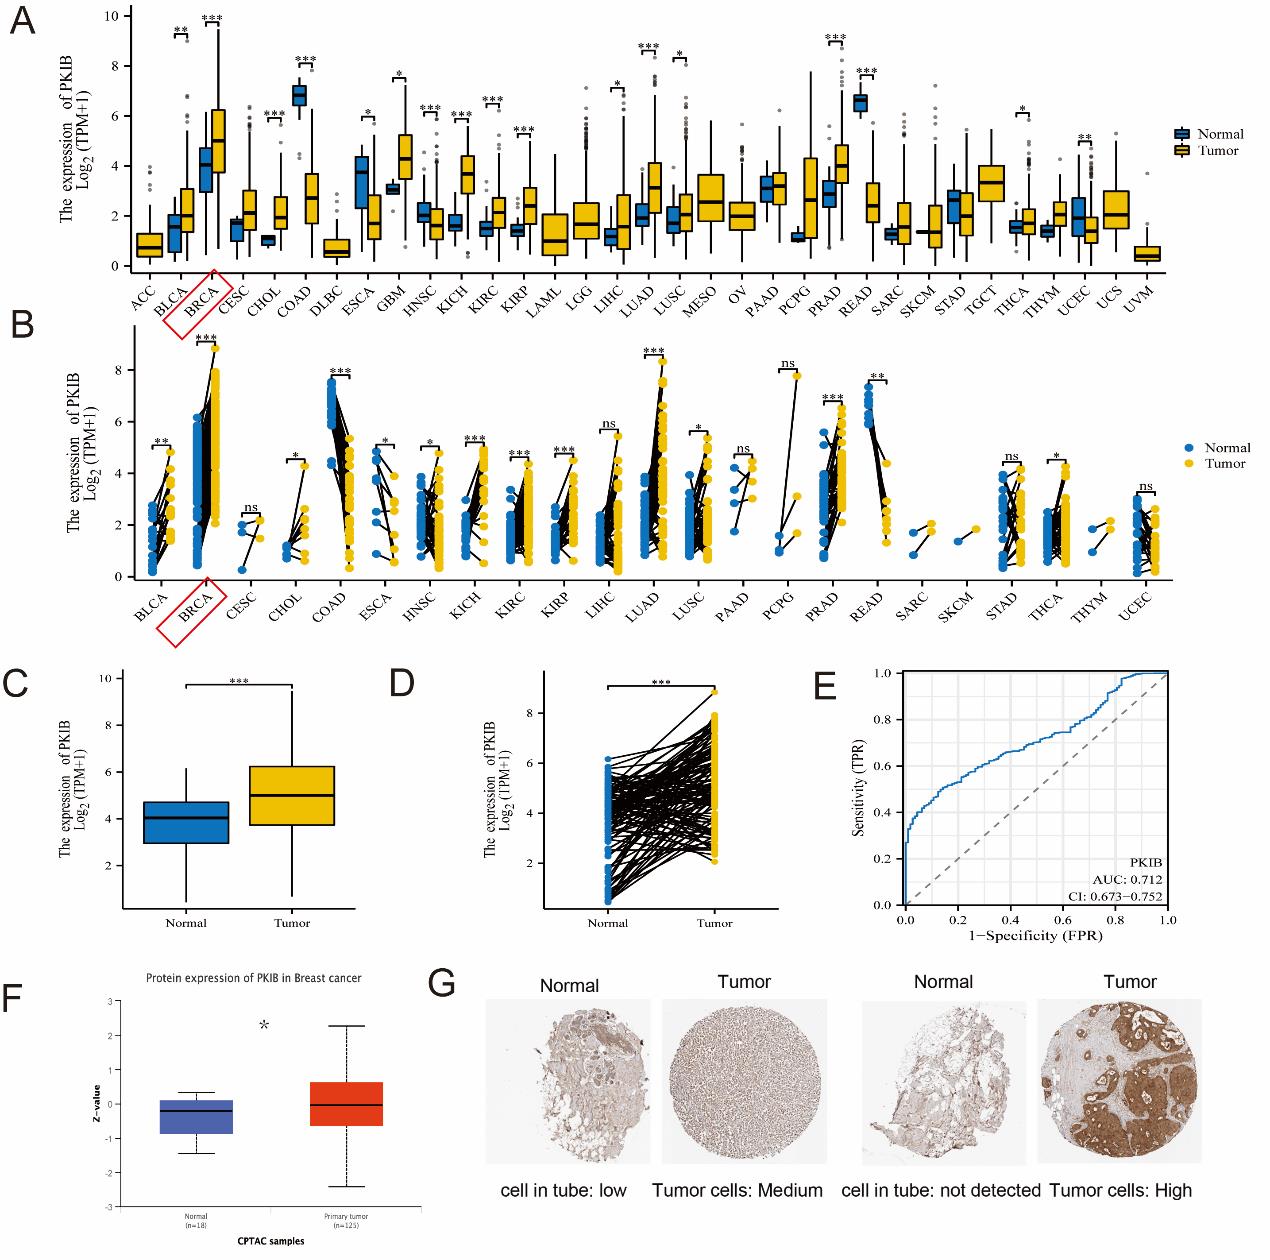
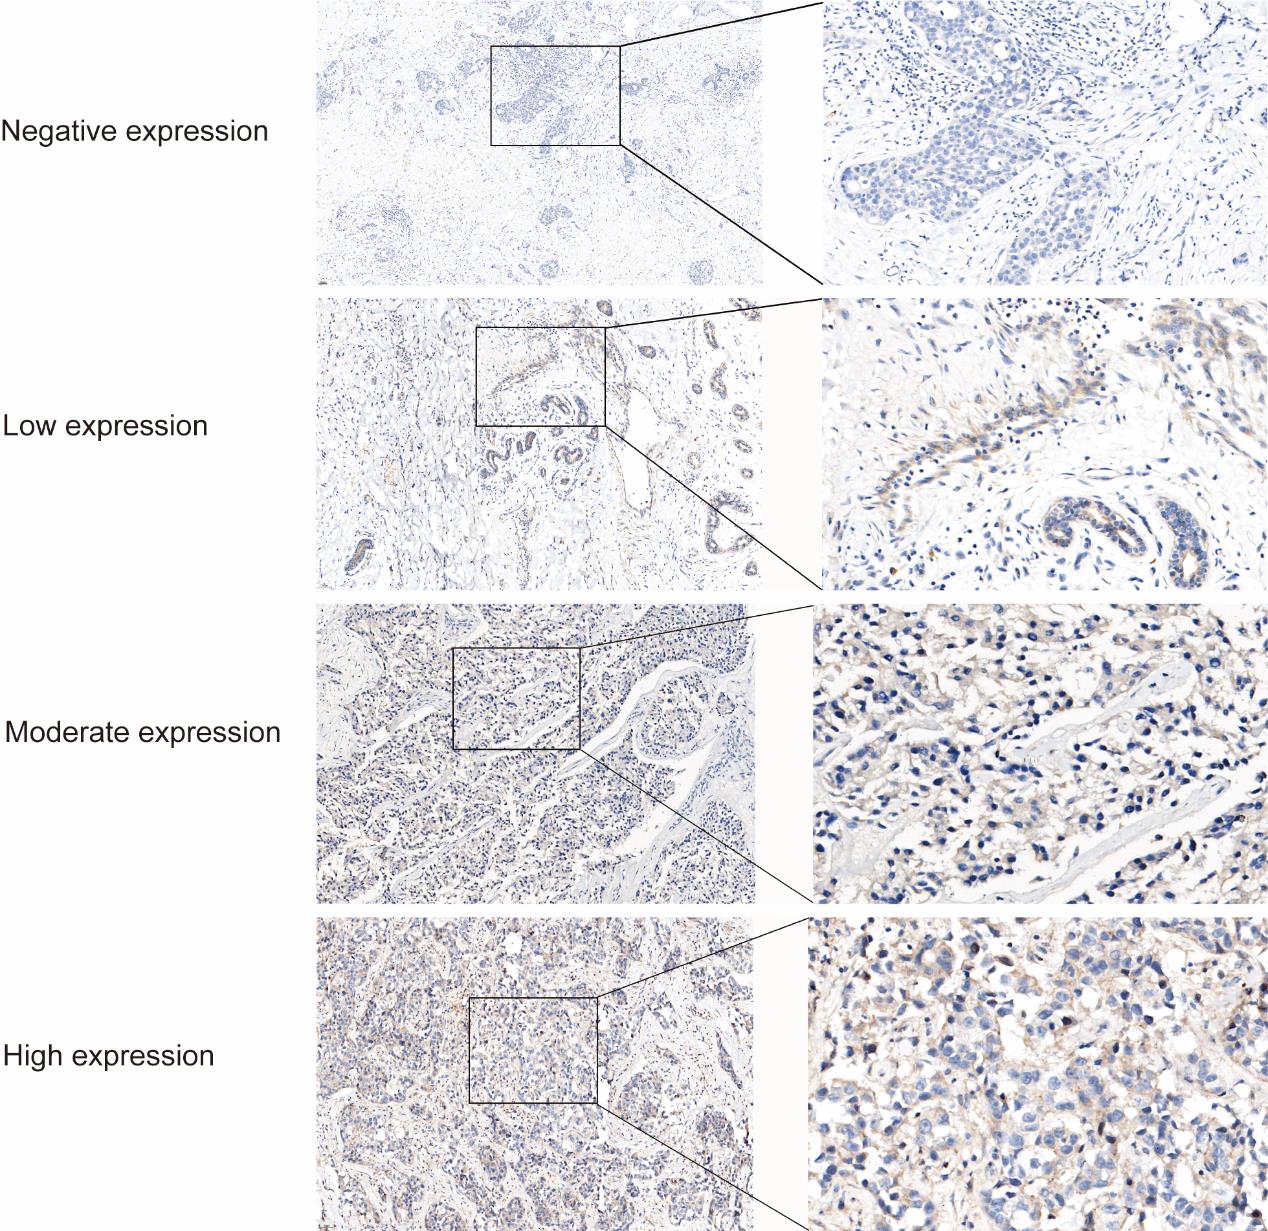
Figure 1: PKIB is increased in BC tissues. (A) PKIB expression in different cancers compared with normal tissues in TCGA and GTEx datasets. (B) PKIB expression in different cancers compared with paired normal tissues in TCGA datasets. (C) PKIB expression in BC compared with normal tissues in BC datasets from TCGA database. (D) PKIB expression in BC compared with paired normal tissues in BC datasets from TCGA database. (E) ROC curves for assessing the specificity and sensitivity of PKIB to differentiate between BC and normal tissues. (F) Protein expression of PKIB in BC and normal tissue in ULCAN datasets. (G) Protein expression of PKIB detected using IHC in HPA database. *p<0.05, **p<0.01, and ***p<0.001.
Figures at a glance