Figure 1: Effect of galangin on the proliferation of BxPC-3 PC cells. (A) CCK-8; (B) Plate cloning assay. *P<0.05,***P<0.001, ****P<0.0001.
Figure 1: Effect of galangin on the proliferation of BxPC-3 PC cells. (A) CCK-8; (B) Plate cloning assay. *P<0.05,***P<0.001, ****P<0.0001.
Figure 2: Scratching assay. nsP>0.05,*P<0.05,**P<0.01,***P<0.001.
Figure 3: Transwell assay. ***P<0.001,****P<0.0001.
Figure 4: 2D structure of Galangin and Canonical SMILES structural formula.
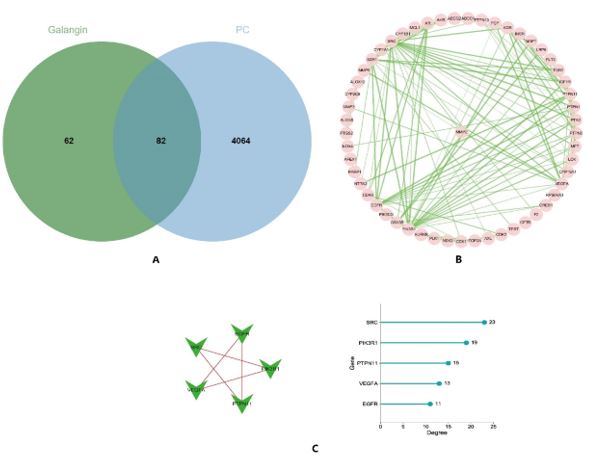
Figure 5: (A) The intersection is the target of Galangin action in pancreatic cancer; (B) Protein-protein interaction network (PPI); (C) Degree algorithm top 5 targets.
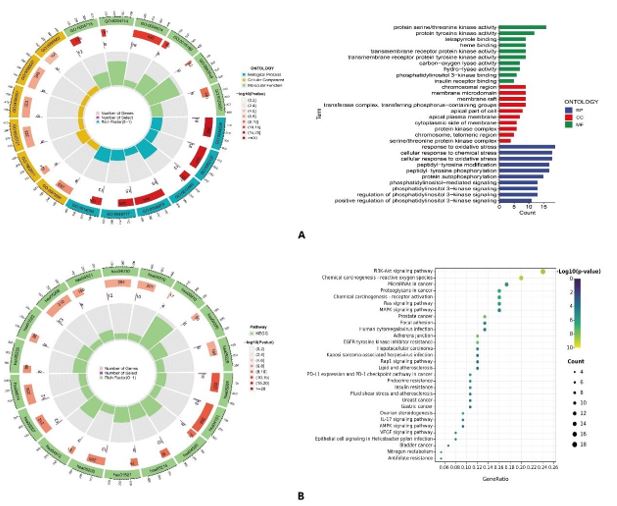
Figure 6: (A) GO annotation analysis; (B) KEGG pathway enrichment analysis.
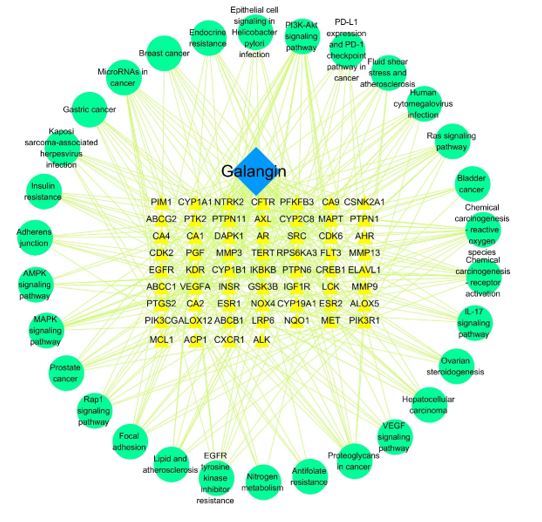
Figure 7: “Drug-target-signaling Pathway” Network.
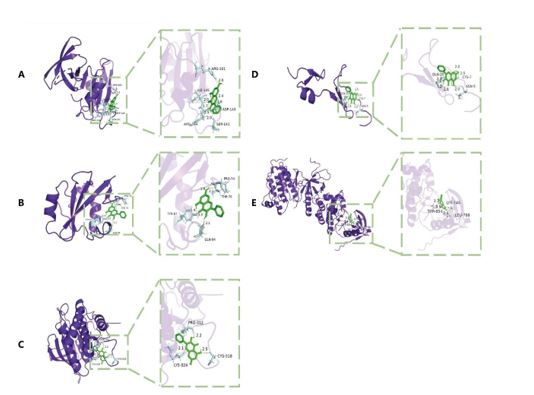
Figure 8: Schematic diagram of molecular docking. (A–E) represent the molecular binding of Galangin with SRC, PIK3R1, PTPN11, VEGFA, and EGFR, respectively.
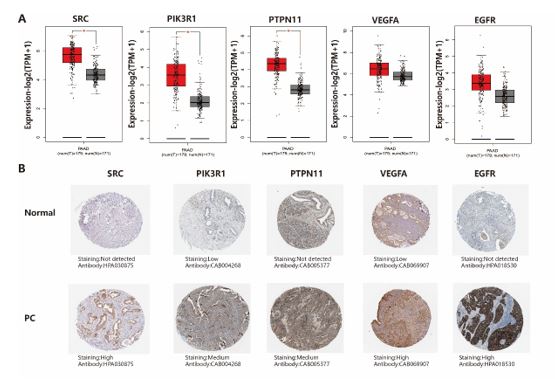
Figure 9: mRNA expression level in the GEPIA database and the protein expression levels in the HPA database. (A) Box plots showing the mRNA expression levels of SRC, PIK3R1, PTPN11, VEGFA, and EGFR. Red represents Tumor, Gray represents normal. (B) Protein expression levels of SRC, PIK3R1, PTPN11, VEGFA and EGFR in normal pancreatic tissue and pancreatic cancer tissue.
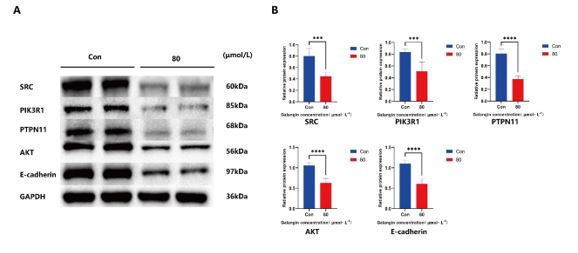
Figure 10: Effect of 80μmol/L galangin on SRC, PIK3R1, PTPN11, AKT, and E-cadherin protein. (A) Protein bands of SRC, PIK3R1, PTPN11, AKT and E-cadherin in control and intervention groups; (B) Relative protein expression of SRC, PIK3R1, PTPN11, AKT and E-cadherin. ***P<0.001,****P<0.0001.
Figures at a glance