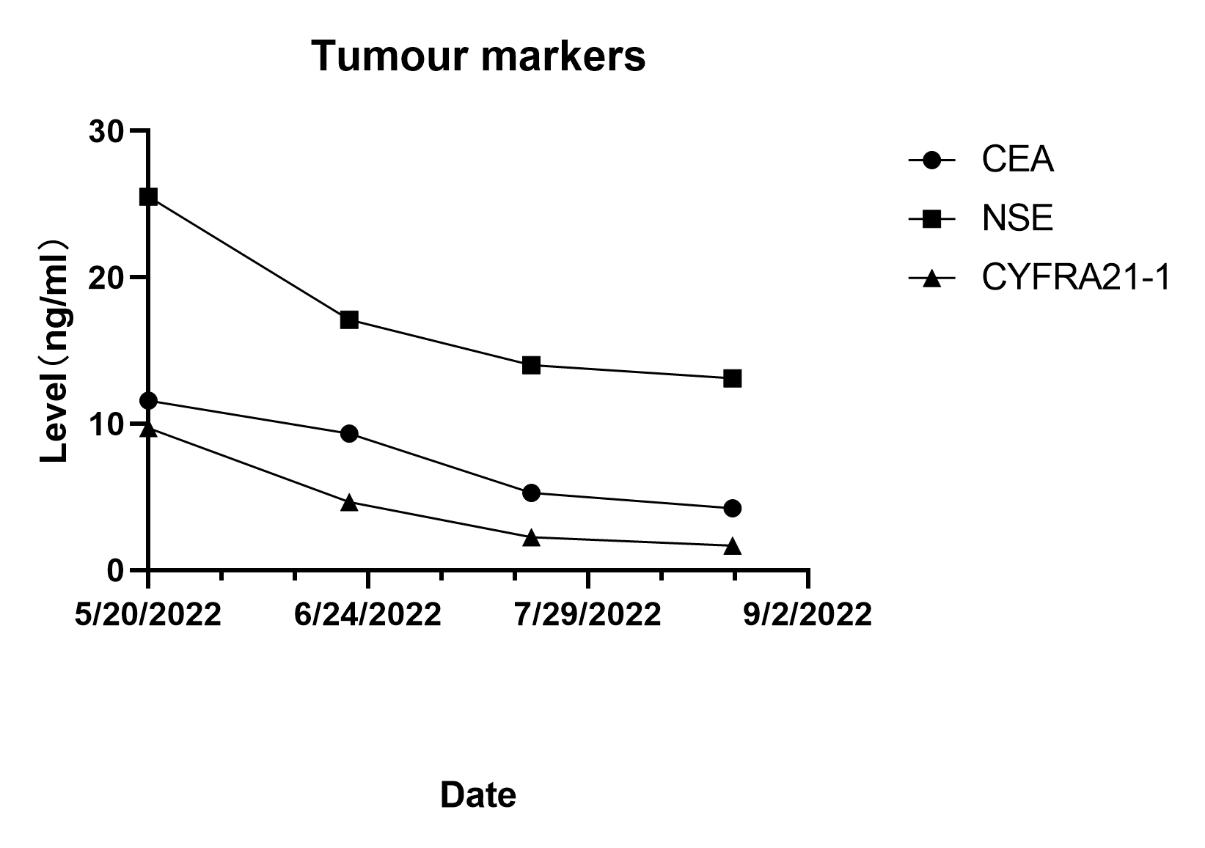
Figure1: Tumour markers including CEA, NSE and Cyfra21-1 continued to decline from first to third cycle treatment.
Figure1: Tumour markers including CEA, NSE and Cyfra21-1 continued to decline from first to third cycle treatment.
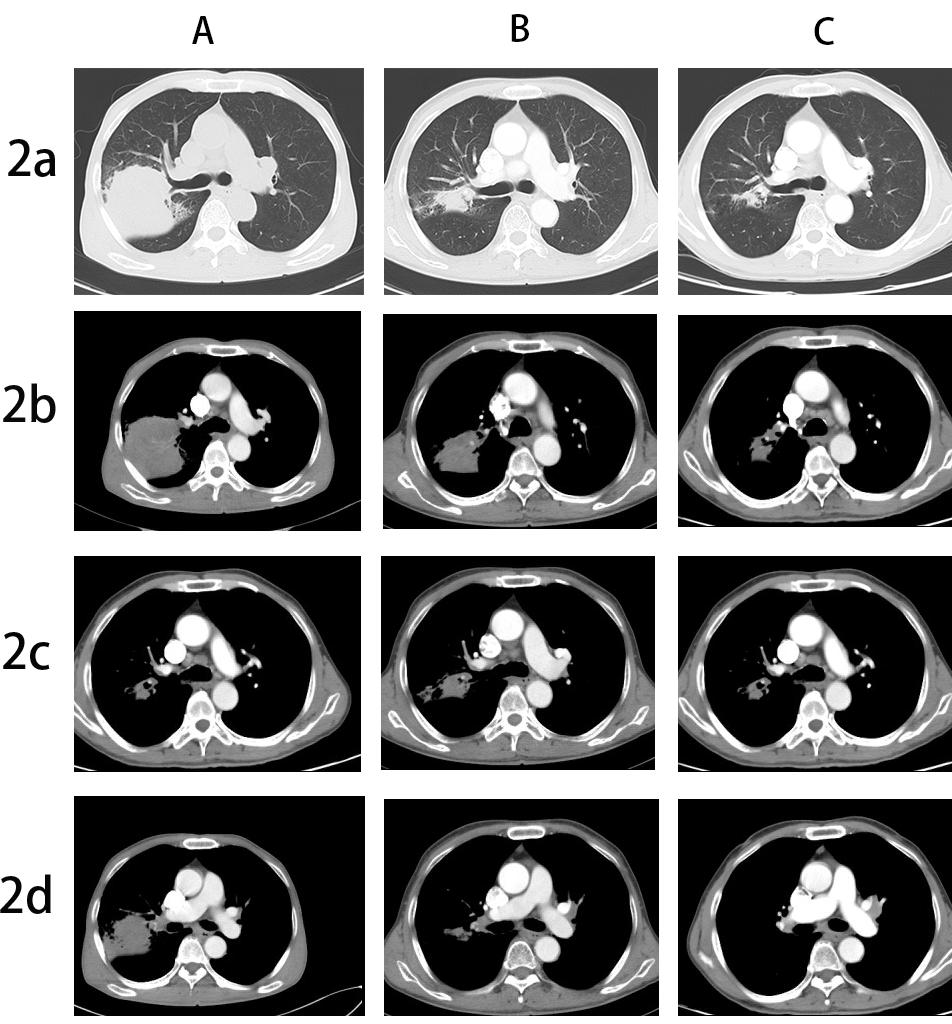
Figure 2a+b. Computed tomography (CT) imaging of primary lesion at different times: (A) before treatment; (B) after two cycles of neoadjuvant immunochemotherapy; (C) after another cycle of neoadjuvant immunochemotherapy; Figure 2c+d. CT imaging of contralateral hilar and mediastinal lymph nodes at different times
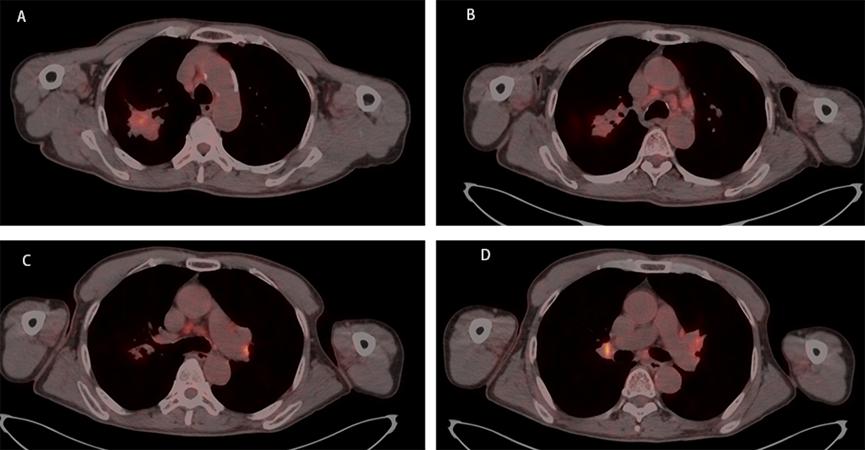
Figure 3A-D. A fluorodeoxyglucose positron emission tomography (FDG‐PET) scan demonstrated that the local residual tumor with slightly high FDG metabolism, the left hilar and mediastinal lymph node enlargement with high FDG metabolism.
Figures at a glance