The Oncogramme® Predicts the Response of Metastatic Ovarian Cancer to Chemotherapeutic Treatment: Link with Patient Care Pathway Through Peritoneal Cancer Index, RECIST Criteria 1.1 and Resective Surgical Operability: A Pilot Study
Received Date: April 02, 2026 Accepted Date: April 13, 2026 Published Date: April 15, 2026
doi:10.17303/jcrto.2026.14.102
Citation: Stéphanie GIRAUD, Tristan GAUTHIER, Ophélie PASINI-CHABOT, Renaud MARTIN, Véronique FERMEAUX, et al. (2026) The Oncogramme® Predicts the Response of Metastatic Ovarian Cancer to Chemotherapeutic Treatment: Link with Patient Care Pathway Through Peritoneal Cancer Index, RECIST Criteria 1.1 and Resective Surgical Operability: A Pilot Study. J Cancer Res Therap Oncol 14: 1-17
Abstract
Objective: Although surgical advances and the success of chemotherapeutic drugs (carboplatin and paclitaxel) have improved outcomes for patients, Ovarian Cancer (OC) remains one of the deadliest cancers worldwide. Indeed, first line treatment is weakly efficient. Rapid, reliable, and adapted tests are thus needed to help clinicians provide personalized chemotherapeutic treatments.
Methods: A pilot study was conducted on 15 patients to evaluate the ability of the Oncogramme® (an innovative ex vivo assay) to predict tumor responses to chemotherapies (sensitivity/resistance). Carbohydrate Antigen 125 (CA125) levels and the Peritoneal Cancer Index (PCI) score were measured to monitor patients. Oncogramme® responses were compared to PCI interpretation, the RECIST 1.1 criteria (the reference used by clinicians to monitor tumor responses to treatment), and patient operability (or suitability for resective surgery).
Results: For the majority of the patients, CA125 levels switch from abnormal to normal during the study period and evolution of PCI scores was favorable. In terms of sensitivity, the Oncogramme® capacity of identification of an efficient treatment reaches 75% if PCI interpretation is used as a marker of response, 75% with the RECIST 1.1 criteria, and 91% with the patient operability as the ultimate proof of the patient’s response.
Conclusion: This pilot study demonstrates potential benefits and utility of the Oncogramme® for predicting the responses of patient tumors to improve patient care. A larger-scale trial is needed to fully validate this test as a new tool for helping clinicians make rapid decisions regarding treatment of these patients.
Keywords: Functional assay; Ovarian cancer; Oncogramme®; Precision medicine; primary culture.
Introduction
Ovarian cancer (OC) is the third most common gynecologic tumor worldwide, with the highest mortality rate of all cancers in women [1]. Several factors increase the risk of developing OC. Among them, germline mutations in the BRCA1 or BRCA2 genes are responsible for 20–25% of high-grade serous carcinoma (HGSC) cases (which represent the most common hereditary condition) [2]. Other known risk factors are age, post-menopausal hormonal therapy, infertility, and null parity.
According to the International Federation of Gynecology and Obstetrics (IFGO) classification, OC has 4 tumor stages defined in function of the tu3mor spread. OC is insidious; often, it is silent and asymptomatic. It is also heterogeneous (subdivided into at least 5 different histological subtypes, with HGSC being the most common) and frequently diagnosed at an advanced stage [3] as it does not require blood or lymph for metastasis [4]. For all stages combined, the 5-year survival rate is <50%.
To determine the extent of disease, diagnostic assessment is based on imaging methods [i.e., ultrasound, Computed Tomography (CT), Magnetic Resonance Imaging (MRI), and (Positron Emission Tomography (PET)-scans [5], and confirmed by histologic criteria and blood analysis of serum molecular tumor markers, of which Carbohydrate Antigen 125 (CA125) is the most common. Indeed, the level of CA125 is a biochemical tool used for management of advanced OC patients who receive first-line paclitaxel/platinum-based chemotherapy [6]. Although CA125 is thought to be rather nonspecific, a recent study shows that levels are related to development and progression of OC, making it useful for early diagnosis, disease development monitoring, and evaluation of prognosis [7]. Furthermore, the RECIST (Response Evaluation Criteria in Solid Tumors) criteria are determined to establish the treatment response of each patient while taking into account the presence of metastasis, their number and their evolution. Defined as the gold standard [8], the latest revised version is RECIST 1.1 [9]. Finally, the Peritoneal Cancer Index (PCI; first described by Sugarbaker) is also useful for disease monitoring. It is measured during operative times (biopsy and surgery ones), and provides an assessment of the local, regional, and general extent of OC [10].
Adequate cancer staging and optimal cytoreduction (either by laparotomy or debulking) are the main goals of the surgical treatment for OC [11,12]. Before surgery, neoadjuvant chemotherapy can be prescribed to allow surgical intervention or increase optimal cytoreduction. After surgery, adjuvant chemotherapy is considered [13]. The backbone chemotherapeutic strategy is a combination of platinum analogs (either cisplatin or carboplatin) plus a taxane (either paclitaxel or docetaxel) [15-17]. Patients that suffer of therapeutic failure can undergo Hyperthermic IntraPEritoneal Chemotherapy (HIPEC) that is the delivery of intraperitoneal chemotherapy (cisplatin) during surgery under hyperthermic conditions [18]. Nearly all patients experience recurrence, leading to the use of the term “Platinum-Resistant Ovarian Cancer” (PROC) [19].
For this reason, developing ex vivo assays destined to individualize treatment, and reducing the gap between clinical assays and “the real life”, is a challenge. These tools should be rapid and provide data that can be used to improve responses to treatment (i.e., the patient prognosis by suggesting better therapeutic options earlier in the disease course), while at the same time avoiding multiple cycles of ineffective drugs that show notable toxicity, thereby reducing the cost of patient care.
The first test was set up in 1977 [20]. Among available tools, companion diagnostic 2D- and 3D-cultures have been developed (for a review, see [21]). Such diagnostic tests were initially named Chemo-Response Assays (CRAs), with the most famous being the MiCK (MicroCulture-Kinetics [22]) and ChemoFx assays [23,24]. Today, those tests are referred to “functional assays” [25]. More recently, and because OC is a heterogeneous malignant tumor, investigations have focused on 3D-culture approaches. Thus, development of organoids and spheroids (non-adherent culture conditions) has increased. These culture systems retain the characteristics of the parental tumor (good genetic stability and high homology [26]), with a complex cellular organization. However, their heterogeneity is also their weakness to use them as an In Vitro Diagnosis Medical Device (IVD-MD). As each fragment of tumor sent for a functional analysis may have a ratio of stromal and tumor cell which did not reflect the real tumor ratio of the global tumor, standardization is impossible and the reliability of the results obtained can be subject to wide variations (sometimes excellent, sometimes unsatisfactory). Moreover, their experimental analysis stays complex and they remain expensive.
Developed by the company Oncomedics, the Oncogramme® is an IVD-MD that possesses numerous advantages over the above assays, as (i) cultured cells keeping characteristics of the parental tumor, ii) a time frame of 15 days maximum, (iii) the use of cancer-specific-defined media, and (iiii) reliable results due to highly sensitive analyses. The Oncogramme® has already been developed for other cancers (colon [27-29] and breast [30,31]). Moreover, technical approval for OC has been undertaken and published [32]. Therefore, we decided to drive a pilot study aiming at evaluating its predictive effectiveness in a small cohort of patients suffering from advanced OC. The aim was to demonstrate the potential of the Oncogramme® as a decision support tool that facilitates decision-making by clinicians to identify patients with tumors likely to be chemo-sensitive/resistant.
Neo-adjuvant chemotherapy is administered to facilitate surgical intervention (linked to PCI determination and operability). Patients were treated accordingly to the standard of care (a combination of platinum analogs plus a taxane). They were monitored using complementary imaging (CT, MRI, and PET-scan), histology characteristics, CA125 levels and PCI scores. Although useful, these markers stay unspecific and need to be completed. Finally, the surgery stays the only curative treatment.
The aim of our study was to determine benefits of Oncogramme® sensitivity in neo-adjuvant conditions compared with usual markers as PCI interpretation, RECIST criteria and patient operability. Data from the Oncogramme® profiles (based on tumor chemo-responses) was analysed for predicting if a treatment i) induce tumor size evolution (based on PCI scores), ii) reduce the tumor progression measured by the RECIST 1.1 criteria, iii) and allow patient operability (or feasibility of surgical cytoreduction). Those criteria are essential for clinicians.
Material and Methods
Study Design
This study was carried out according to The Code of Ethics of the World Medical Association (Declaration of Helsinki). Informed consent was obtained from all participants. The study was approved by the author’s institutional board and was performed under regulatory authorization (ClinicalTrials.gov database, registration number: NCT02910622) on 22th September 2016.
Demographics and Description of the Study Population
Quantitative variables [age (years), body mass index (kg/m2)], determination of disease characteristics (by CT, MRI, and/or PET-scan), histology data and CA125 levels (IU/mL and interpretation), determined by clinicians, were obtained from Case Report Forms.
Inclusion/Exclusion Criteria
OC specimens, obtained from included patients during primary tumor resection at University Hospital and private institute from June 2012 to June 2016, were anonymized.
Inclusion criteria were as follows: consent to use tumor samples; aged ≥18 years with operable stage IIIc or IV (with pleural effusion) cancer (based on the IFGO classification); OC requiring induction treatment, with disease measurable according to the RECIST 1.1 criteria by MRI or CT, or evaluable by PET-scan (PCI score); patients without cancer within 5 years (with the exception of basal cell carcinoma, spino cell carcinoma, or treated cervical cancer in situ); and patients not included in a therapeutic trial involving an investigational compound.
Non-inclusion criteria were as follows: lack of contraception for women of childbearing age; receipt of targeted therapy, hormone therapy, or concurrent radiation therapy; inability to attend follow-ups for geographical, social, or psychological reasons; deprivation of liberty by administrative or judicial decision; a person under guardianship; difficulty in understanding the study protocol; and lack of coverage by social security insurance.
The Oncogramme® Process and Profiles
Tissue samples collect, preparation, primary culture, and Oncogramme® analysis were conducted as described previously [32] using stock solutions of chemotherapeutics (Calbiochem, Saint-Quentin-Fallavier, France). The carboplatin/paclitaxel (termed as Carbo/Taxol) ratio was determined as follows: %cytotoxicity (Carbo/Taxol) / %cytotoxicity Control.
The quartile method (median, minimum, maximum, 25th, and 75th quartiles) was applied to categorize samples as sensitive (Carbo/Taxol ratio > the 75th quartile), intermediate (Carbo/Taxol ratio between the 75th and 25th quartiles), or resistant (Carbo/Taxol ratio < the 25th quartile), as described previously [28].
PCI Scores and Interpretation
PCI scores give information on invaded areas observed during operative times (biopsy and surgery ones). They were determined at the time of biopsy and then again, at the time of surgery [10,33]. Three independent analyses were made by surgeons.
Results are explained in terms of PCI categorization based on the difference between PCI scores at the time of biopsy and at the time of surgery. The quartile method was applied to classify TA, TB and TC categories as Favorable (PCI evolution > the 75th quartile), and TD category as Unfavorable (PCI evolution < the 25th quartile).
RECIST 1.1 Criteria and Surgical Process
The RECIST 1.1 criteria [9,34] categorize patients based on their complete response (CR), partial response (PR), stable disease (SD), and progressive disease (PD). With respect to therapeutic care, “responders” were defined with a complete/partial response as a stable disease, versus “non-responders” having a progressive disease.
The clinicians decided whether a patient was suitable for surgical resection (laparotomy and debulking) or for observational examination (by coelioscopy).
Statistical Analysis
Contingency tables were constructed by matching results observed on patients (PCI interpretation, RECIST 1.1 criteria and operability) and Oncogramme® categorizations. It allows determination of true positives (A, patients termed as sensitive/intermediate by Oncogramme® and who have answered positively to the analyzed criteria) and true negatives (D, patients termed as resistant by Oncogramme® and who have answered negatively to the analyzed criteria). In the Tables, (B) corresponds to patients identified as sensitive/intermediate by Oncogramme® and who answered negatively to the analyzed criteria (false positive), and (C) corresponds to patients identified as resistant by Oncogramme® and who answered positively to the analyzed criteria (false negative). These different values permit calculation of indicative data (see below) using the formula described before [28,35]:
Sensitivity is defined as the capacity of the test to predict a positive result (sensitive or intermediate) when a patient answers positively to the analyzed criteria (responder); it is calculated by the formula A/(A+C).
Specificity is defined as the capacity of the test to predict a negative result (resistant) when a patient answers negatively to the analyzed criteria (non-responder); it is calculated by the formula D/(B+D).
Positive Predictive Value (PPV) is defined as the probability that the tumor is sensitive to chemotherapy when the test predicts it; it is calculated by the formula A/(A+B).
Negative Predictive Value (NPV) is defined as the probability that the tumor is resistant to chemotherapy when the test predicts it; it is calculated by the formula D/(C+D).
Predictive Capacity (PC) is the capacity of the test to predict tumor responses to chemotherapy; it is calculated by the formula (A+D)/(A+B+C+D).
The 95 % confidence intervals (CIs) were calculated with the exact method. To quantify concordance between Oncogramme® results following categorization and results observed on patients, Kappa coefficient, ranging from −1 to 1, was also estimated with a 95 % confidence interval. For its interpretation, categories from Landis and Koch were used: Poor, Slight, Fair, Moderate, Substantial and Almost Perfect agreement for coefficient values ranging between -1 and 0, 0 and 0.2, 0.21 and 0.4, 0.41 and 0.6, 0.61 and 0.8 and 0.81 and 1.0, respectively.
Results
Patient Characteristics
Twenty-two OC samples corresponding to operable stage IIIc or IV pleural IFGOs were suitable for Oncogramme® analysis. Three of them were excluded because inclusion number was achieved. Moreover, 4 samples not usable for cell culture (1 with bacterial contamination and 3 with too few cells) were excluded, leaving 15 patients and 16 samples for analysis (Oncogramme® realized on 2 different samples from one same patient; Figure 1). Disease was characterized by CT, MRI, and PET scans that identified peritoneal carcinosis (Table 1). Histology confirmed cellular characteristics of OC (i.e., HGSC).
CA125 Levels and PCI Scores
CA125 levels were measured by different laboratories during the preoperative and post-therapeutic period (Table 2a). During the post-therapeutic period, 6/15 patients (40%) had normal values, 7/15 (46.7%) had abnormal values, and 2/15 patients (patients 24 and 59; 13.3%) had non-determined data. For the majority of included patients (13/15, 86.7%), CA125 levels post-treatment were lower than those of pretreatment.
PCI scores were determined by clinicians during biopsy and surgery that allows determination of patient evolution (as PCI interpretation; Table 2b). Only, four patients experienced unfavorable evolution (patients 21, 23, 54 and 55).
For the majority of included patients, CA125 levels and the PCI interpretation are in accordance with the favorable evolution of OC (Table 2 a and b), as described by CA125 monitoring [7].
Oncogramme® Results
Sixteen fresh OC specimens from resected primary tumors were anonymized and analyzed by the Oncogramme® (2 samples from the same patient were obtained; patient 12; Table 3a). Data were expressed as percentage of cell death for the non-treated (termed as Control) and treated (termed as Carbo/Taxol) conditions. The results were used to determine the Carbo/Taxol ratio, which allows categorization of OC as sensitive/intermediate/resistant, using the quartile method (Table 3b).
Among the 16 analyzed samples, 4 were sensitive (25%), 8 were intermediate (50%), and 4 were resistant (25%). Sensitive and intermediate samples were grouped together (12/16; 75%) for the rest of the study.
Matching Between the Oncogramme® Profiles and the PCI Interpretation
Using the quartile method, Table 4 matches the PCI interpretation with the Oncogramme® categorization: sensitivity was 75% [9/12, 95 % CI (43; 95)], with 9 true positive patients. Specificity was 25% [1/4, 95 % CI (01; 81)], with one true negative patient. Moreover, PPV was 75% [9/12, 95 % CI (43; 95)], NPV was 25% [1/4, 95 % CI (01; 81)], and PC was 63% [10/16, 95 % CI (35; 85)]. The kappa coefficient, calculated at 0, indicates that there is no agreement between ex vivo and clinical results.
Matching Between the Oncogramme® Categorization and the RECIST 1.1 Criteria
The RECIST 1.1 criteria for each patient were analyzed by clinicians. As shown in Table 5a, 13/15 patients had a complete/partial response (86.7%) and 2/15 had a stable disease (13.3%). Because none had a progressive disease, all patients were considered as “responders” in term of RECIST 1.1 criteria.
For the 16 analyzed samples, patient clinical responses were cross tabulated with the Oncogramme® categorization (Table 5b). Sensitivity was 75% [12/16, 95 % CI (48; 93)], with 12 true positive patients. Specificity and NPV were undetermined because none true negative patients was observed. Moreover, PPV and PC were determined at 100% [12/12, 95 % CI (74; 100)] and 75% [12/16, 95 % CI (48; 93)] respectively. The kappa coefficient, calculated at 0, indicates that there is no agreement between ex vivo and clinical results.
Matching Between the Oncogramme® Profiles and the Patient Tumor Operability
As part of standard care, patients were treated as follows: cytoreductive surgery (laparotomy or debulking), 11/15 (73.3%); coelioscopy, 3/15 patients (20%); no surgery [death during the study period, 1/15 patient (6.6%); Table 6a].
Table 6b matches the patient operability with the Oncogramme® categorization. Sensitivity was 91% [10/11, 95 % CI (59; 99)], with 10 true positive patients. Specificity was 60% [3/5, 95 % CI (15; 95)], with 3 true negative patients. Moreover, PPV was 83% [10/12, 95 % CI (52; 98)], NPV was 75% [3/4, 95 % CI (19; 99)], and PC was 81% [13/16, 95 % CI (54; 96)]. The kappa coefficient, calculated at 0.54 [95 % CI (0.05; 1)].
Discussion
OC is one of the most worrying cancers in women due to its high mortality rate [1]. Often diagnosed at an advanced stage, it is a heterogeneous disease, difficult to treat. First-line therapy comprises a combination of surgery and chemotherapeutic drugs (platinum analogues plus a taxane [15]); however, sooner or later, the tumors become resistant [19], reinforcing the need to develop tests that predict tumor responses.
The main objective of this retrospective study was to analyze the predictive values of the Oncogramme® by conducting a pilot study on 15 patients with OC (Figure 1) in order to obtain information regarding the effectiveness of the test so that a prospective clinical study can be launched on a large number of patients. This test is based on the results of our previous control study [32], which validated the technical application of the Oncogramme® in OC.
CT/MRI/PET images and histological findings show that the majority of patients had peritoneal carcinosis (Table 1) in accordance with inclusion criteria (advanced OC stage). However, it would have been interesting to i) include other OC types in the analysis, notably platinum-resistant tumors (or PROC), ii) to assess the mutational status of the BRCA1 and BRCA2 genes, and iii) to have the survival rate of patients.
Patients were monitored via measurement of CA125 levels. In most patients, CA125 levels decreased post-treatment in accordance with a favorable disease course. However, based on standards specific to each laboratory, abnormal levels were identified in 46.7% of cases (Table 2a), even after treatment. CA125 levels can fall even when OC progresses. In fact, a previous study showed that patients with low serum CA125 levels have the same clinical outcome as patients with high levels [36], demonstrating the non-specificity of this marker.
PCI scores were calculated to assess tumor invasion, and the vast majority of patients showed a clear decrease in the PCI score between biopsy and surgical intervention as noted as favorable PCI interpretation (Table 2b).
However, while used in hospital practice, results obtained with CA125 and PCI demonstrate that it is still necessary to search more specific markers to gain a more accurate picture of disease behavior. While non-invasive methods such as imaging improve patient monitoring [5], helping clinicians to predict the efficacy of treatment before treating would be of great value, notably to benefit of effective surgery [11]. Here, we show that the Oncogramme® could meet this need.
Oncogramme® analysis (Table 3a and b) allowed samples to be classified into 2 groups: sensitive or intermediate (12/15; 80%) and resistant (3/15; 20%). Moreover, sensitivities of the Oncogramme® were of 75% for PCI interpretation (Table 4), 75% for RECIST criteria (Table 5b) and 91% for patient operability (Table 6b).
For PCI interpretation (Table 4), the test shows a sensitivity of 75% [9/12, 95 % CI (43; 95)] because it was able to identify 9 patients among the 12 patients for whom Oncogramme® tests were sensitive to treatment and whom disease evolution was favorable based on PCI interpretation. With a PC of 63% [10/16, 95 % CI (35; 85)], the Oncogramme® is able to predict PCI evolution (favorable or unfavorable) for almost two out of three times before the start of the treatment. The kappa coefficient in this case is very weak, this probably being related to the fact that the specificity is low 25% [1/4, 95% CI (01; 81)].
The RECIST 1.1 criteria provide a practical method for evaluating global tumor responses (primary tumor and metastasis) [9,34]. All patients enrolled in the present study were classified as responders according to the RECIST 1.1 criteria (Table 5a), thanks to the effectiveness of chemotherapeutic treatment. Although the RECIST classification was revised in 2018, major limitations continue to persist, including variability of tumor size measurements and tumor heterogeneity [37]. The criteria did not take three-dimensional tumor volume into account, nor imaging intensity, nor tumor growth rate. For these criteria, the Oncogramme® assay demonstrates the characteristics of a reliable test (Table 5b). The sensitivity is 75% [12/16, 95 % CI (48; 93)] (due to detection of 12 sensitive/intermediate patients among 16 responders), that is essential for a test designed to predict responses to treatment. Moreover, the high PPV (100%) demonstrates the ability of the Oncogramme® to identify responders among sensitive/intermediate patients, and the adequate PC (75%) highlights its ability to predict patients’ response to treatment. However, these results should be interpreted with caution, as no patient was classified as having a progressive tumor according to RECIST criteria. Therefore, specificity and NPV could not be calculated. The PC of the Oncogramme® according to RECIST criteria will thus need to be recalculated on a larger number of patients, including those whose tumors will be assessed as progressive. Nevertheless, sensitivity and PPV, which are not impacted by this absence of patients with progressive tumors, remain promising.
For patient tumor tissue operability (Table 6b), the specificity of the test was 60% [3/5, 95 % CI (15; 95)], which means that it correctly identified the 3 resistant patients among the 5 patients who were too resistant to the treatment chosen empirically that they did not have a resection surgery. Sensitivity was 91% [10/11, 95 % CI (59; 99)] because the test correctly identified 10 patients sensitive/intermediate among the 11 patients who underwent resection surgery. These data are reflected in the PPV score of 83% [10/12, 95 % CI (52; 98)] and the NPV score of 75% [3/4, 95 % CI (19; 99)]. Finally, the PC score of 81% [13/16, 95 % CI (54; 96)] illustrates the capacity of the Oncogramme® to predict operability (suitability for surgery) of patients in function of the ex vivo response of their tumor. The kappa coefficient, calculated at 0.54 [95 % CI (0.05; 1)], indicates that there is a moderate agreement between ex vivo and clinical results. Compared with patient tumor tissue operability, the Oncogramme® shows good overall performance, with large CI being related to the small sample size of the study.
The data presented herein are broadly consistent with those for ATP-based functional assays on OC reported in the literature (sensitivity 95%, specificity 44%, PPV 66% and NPV 89%) [38]. Differences can be explained by the characteristics of the patient group (only FIGO stage III OC; N = 38) and drug associations used in the ATP-based assay.
Numerous clinical studies have validated ex vivo assays for analyze treatment responses. For example, the response rate of PROC patients included in the ATP-based Tumor Chemosensitivity Assay (ATP-TCA) arm (for whom treatment was based on chemotherapy-sensitivity analysis) was superior to that in the physician’s-choice arm (40.5% versus 31.5% [39]). Moreover, the ATP-TCA showed favorable response rates (59% with 33/56 patients who undergo chemotherapy based on in vitro ATP-TCA responses) when used to predict responses of patients with recurrent epithelial OC to individualized chemotherapy [40]. Finally, another study demonstrated improved survival rates in patients treated with chemotherapy regimens selected thank to ex vivo drug testing: 38 versus 21 months for the overall survival (P=.005) and 15 versus 7 months for the progression-free median survival (P=.0002) in the assay group compared with the control group [41].
Previously, Oncomedics’ searchers validated the Oncogramme® using different tumor models: for colorectal cancer, the initial technical description of the assay [27], a pilot study of 19 patients [28], and a multicenter/prospective trial of 256 patients [29]. Moreover, the method was validated in breast cancer to analyze data from 40 patients [30], and the assay was used to assess 10 patients expressing Human Epidermal Growth Factor Receptor-2 treated with Herceptin (a monoclonal antibody) [31]. With respect to OC, a study of 28 patients demonstrated the usefulness of the Oncogramme® [32]. Thus, Oncogrammes® are more than just a proof of concept: they are useful tools for clinicians that should be used routinely in the clinic.
This study demonstrated that the ability of the Oncogramme® to predict tumor response in first-line treatment is very promising. Thereby, it could 1) avoid treating patients with ineffective molecules, 2) avoid secondary effects from inefficient treatment combination, and 3) reduce the treatment cost. After relapse which occurs frequently, it could permit to adapt the second-line treatment (notably Caelyx, Topotecan, Vepeside… [32]). Indeed, today, the quantity of available drugs has increased the number of their possible associations. Because the Oncogramme® has the capacity to test numerous drugs and drug associations, the possibilities are endless to adapt future therapies and to improve patient cures.
Conclusion
Following on its technical validation [32], the results of this pilot study which establish the diagnosis performances of the Oncogramme® for OC are encouraging. Sensitivity, PPV and PC of the assay are consistent with the clinical responses of the tumor tissues according to the RECIST 1.1 criteria, while specificity and NPV could not be calculated due to the absence of patients whose tumor was resistant to treatment. More importantly, Oncogramme® is in accordance with the patient outcomes regarding tumor tissue operability, which is the most important prognosis impact factor. This new personalized tool could help clinicians rapidly (turnaround time, 15 days for all the Oncogramme® process) distinguish sensitive/resistant patients, thus allowing efficient personalized therapeutic management for each patient. At any rate, although the Oncogramme® can assist clinicians, this test remains an investigational method with respect to OC. Further clinical studies with more participants, including platinum-resistant patients, are now needed to fully validate the test.
Acknowledgments
The authors thank all of the patients for their participation.
All authors have read the journal’s authorship agreement and its policy on disclosure of potential conflicts of interest.
This work was conducted under Trial registration no. NCT02910622, and recorded on 22th September, 2016.
Funding
This study was sponsored by the CHU de Limoges, by the 2010 local project call.
Ethical Considerations
SG (General and Scientific Director) and CL (President and Chief Operating Officer) are employees of Oncomedics SAS. OPC is an employee of Oncomedics SAS. TG, RM, VF, SL, PMP, ED, NTM, LV, AF, FG, JM, and AP have no conflicts of interest to declare.
- Momenimovahed Z, Tiznobaik A, Taheri S, Salehiniya H (2019) Ovarian cancer in the world: epidemiology and risk factors. Int J Womens Health. 11: 287-99.
- Pietragalla A, Arcieri M, Marchetti C, Scambia G, Fagotti A (2020) Ovarian cancer predisposition beyond BRCA1 and BRCA2 genes. Int J Gynecol Cancer Off J Int Gynecol Cancer Soc. 30: 1803-10.
- Matulonis UA, Sood AK, Fallowfield L, Howitt BE, Sehouli J, Karlan BY (2016) Ovarian cancer. Nat Rev Dis Primer. 2: 16061.
- Lengyel E (2010) Ovarian cancer development and metastasis. Am J Pathol. 177: 1053-64.
- Rizzo S, Del Grande M, Manganaro L, Papadia A, Del Grande F (2020) Imaging before cytoreductive surgery in advanced ovarian cancer patients. Int J Gynecol Cancer Off J Int Gynecol Cancer Soc. 30: 133-8.
- Gadducci A, Cosio S, Fanucchi A, Negri S, Cristofani R, Genazzani AR (2004) The predictive and prognostic value of serum CA 125 half-life during paclitaxel/platinum-based chemotherapy in patients with advanced ovarian carcinoma. Gynecol Oncol. 93: 131-6.
- Wan Q, Liu Y, Lv B, Chen X (2021) Correlation of Molecular Tumor Markers CA125, HE4, and CEA with the Development and Progression of Epithelial Ovarian Cancer. Iran J Public Health. 50: 1197-205.
- Therasse P, Arbuck SG, Eisenhauer EA, Wanders J, Kaplan R S, Rubinstein L et al. (2000) New guidelines to evaluate the response to treatment in solid tumors. European Organization for Research and Treatment of Cancer, National Cancer Institute of the United States, National Cancer Institute of Canada. J Natl Cancer Inst. 92: 205-16.
- Eisenhauer EA, Therasse P, Bogaerts J, Schwartz L H, Sargent D, Ford R et al. (2009) New response evaluation criteria in solid tumours: revised RECIST guideline (version 1.1). Eur J Cancer Oxf Engl 1990. 45: 228-47.
- Gouy S, Belghiti J, Uzan C, Canlorbe G, Gauthier T, Morice P (2013) Accuracy and reproducibility of the peritoneal cancer index in advanced ovarian cancer during laparoscopy and laparotomy. Int J Gynecol Cancer Off J Int Gynecol Cancer Soc. 23: 1699-703.
- Hernandez-Lopez LA, Elizalde-Mendez A (2020) How far should we go in optimal cytoreductive surgery for ovarian cancer? Chin Clin Oncol. 9: 70.
- Dion L, Lavoué V (2021) Ovarian Cancer: Latest Advances and Prospects. J Clin Med. 10: 5919.
- Kuroki L, Guntupalli SR (2020) Treatment of epithelial ovarian cancer. BMJ. 371: m3773.
- Lheureux S, Gourley C, Vergote I, Oza AM (2019) Epithelial ovarian cancer. Lancet Lond Engl. 393: 1240-53.
- Orr B, Edwards RP (2018) Diagnosis and Treatment of Ovarian Cancer. Hematol Oncol Clin North Am. 32: 943-64.
- Ouali K, Michels J, Blanc-Durand F, Leary A, Kfoury M, Genestie C et al. (2023) [Current post-surgical treatment strategies in first-line ovarian cancer]. Bull Cancer. 111: 267-76.
- Lheureux S, Gourley C, Vergote I, Oza AM (2019) Epithelial ovarian cancer. Lancet. 23; 393: 1240-53.
- Gajarawala S, Pelkowski J, Dorian R, Stanton A, Dinh T (2021) Hyperthermic intraperitoneal chemotherapy for treating ovarian cancer. JAAPA Off J Am Acad Physician Assist. 34: 50-3.
- Davis A, Tinker AV, Friedlander M (2014) “Platinum resistant” ovarian cancer: what is it, who to treat and how to measure benefit? Gynecol Oncol. 133: 624-31.
- Hamburger AW, Salmon SE (1977) Primary bioassay of human tumor stem cells. Science. 197: 461-3.
- Singh T, Neal AS, Moatamed NA, Memarzadeh S (2020) Exploring the Potential of Drug Response Assays for Precision Medicine in Ovarian Cancer. Int J Mol Sci. 22: E305.
- Salom E, Penalver M, Homesley H, Burrell M, Garrett A, Presant CA et al. (2012) Correlation of pretreatment drug induced apoptosis in ovarian cancer cells with patient survival and clinical response. J Transl Med. 10: 162.
- Brower SL, Fensterer JE, Bush JE (2008) The ChemoFx assay: an ex vivo chemosensitivity and resistance assay for predicting patient response to cancer chemotherapy. Methods Mol Biol Clifton NJ. 414: 57-78.
- Herzog TJ, Krivak TC, Fader AN, Coleman RL (2010) Chemosensitivity testing with ChemoFx and overall survival in primary ovarian cancer. Am J Obstet Gynecol. 203: 68.e1-6.
- Morand du Puch CB, Vanderstraete M, Giraud S, Lautrette C, Christou N, Mathonnet M (2021) Benefits of functional assays in personalized cancer medicine: more than just a proof-of-concept. Theranostics. 11: 9538-56.
- Liu HD, Xia BR, Jin MZ, Lou G (2020) Organoid of ovarian cancer: genomic analysis and drug screening. Clin Transl Oncol Off Publ Fed Span Oncol Soc Natl Cancer Inst Mex. 22: 1240-51.
- Loum E, Giraud S, Bessette B, Battu S, Mathonnet M, Lautrette C (2010) Oncogramme, a new individualized tumor response testing method: application to colon cancer. Cytotechnology. 62: 381-8.
- Bounaix Morand du Puch C, Nouaille M, Giraud S, Labrunie A, Luce S, Preux PM et al. (2016) Chemotherapy outcome predictive effectiveness by the Oncogramme: pilot trial on stage-IV colorectal cancer. J Transl Med. 14: 10.
- Mathonnet M, Vanderstraete M, du Puch CBM, Giraud S, Lautrette C, Ouaissi M et al. (2021) ONCOGRAM: study protocol for the evaluation of therapeutic response and survival of metastatic colorectal cancer patients treated according to the guidelines of a chemosensitivity assay, the Oncogramme®. Trials. 22: 556.
- Giraud S, Loum E, Bessette B, Fermeaux V, Lautrette C (2011) Oncogramme, a new promising method for individualized breast tumour response testing for cancer treatment. Anticancer Res. 31: 139-45.
- Giraud S, Bounaix Morand du Puch C, Fermeaux V, Guillaudeau A, Lautrette C (2012) Oncogramme responses of breast tumour cells treated with herceptin correlate with HER2/C-ERB B2 pathological status. Anticancer Res. 32: 1323-5.
- Giraud S, Croce S, Bessette B, Stoeckle E, Guyon F, Mac Grogan G et al. (2014) Oncogramme, an Adapted Method for Individualized Tumour Response Testing of Ovary Cancer Treatments. J Cancer Res Therap Oncol. 2: 1-9.
- Di Donna MC, Cucinella G, Zaccaria G, Lo Re G, Crapanzano A, Salerno S et al. (2023) Concordance of Radiological, Laparoscopic and Laparotomic Scoring to Predict Complete Cytoreduction in Women with Advanced Ovarian Cancer. Cancers. 15: 500.
- Rustin GJS, Vergote I, Eisenhauer E, Pujade-Lauraine E, Quinn M, Thigpen T et al. (2011) Definitions for response and progression in ovarian cancer clinical trials incorporating RECIST 1.1 and CA 125 agreed by the Gynecological Cancer Intergroup (GCIG). Int J Gynecol Cancer Off J Int Gynecol Cancer Soc. 21: 419-23.
- Nendaz MR, Perrier A (2004) [Sensitivity, specificity, positive and negative predictive value of a diagnostic test]. Rev Mal Respir. 21: 390-3.
- Asali A, Haj-Yehia N, Zehavi T, Perry T, Beiner M, Fishman A et al. (2021) High grade, advanced, serous ovarian cancer with low serum CA125 levels. J Obstet Gynaecol J Inst Obstet Gynaecol. 41: 1107-11.
- Nishino M (2018) Tumor Response Assessment for Precision Cancer Therapy: Response Evaluation Criteria in Solid Tumors and Beyond. Am Soc Clin Oncol Educ Book Am Soc Clin Oncol Annu Meet. 38: 1019-29.
- Konecny G, Crohns C, Pegram M, Felber M, Lude S, Kurbacher C et al. (2000) Correlation of drug response with the ATP tumor chemosensitivity assay in primary FIGO stage III ovarian cancer. Gynecol Oncol. 77: 258-63.
- Cree IA, Kurbacher CM, Lamont A, Hindley AC, Love S, TCA Ovarian Cancer Trial Group (2007) A prospective randomized controlled trial of tumour chemosensitivity assay directed chemotherapy versus physician’s choice in patients with recurrent platinum-resistant ovarian cancer. Anticancer Drugs. 18: 1093-101.
- Sharma S, Neale MH, Di Nicolantonio F, Knight LA, Whitehouse PA, Mercer SJ et al. (2003) Outcome of ATP-based tumor chemosensitivity assay directed chemotherapy in heavily pre-treated recurrent ovarian carcinoma. BMC Cancer. 3: 19.
- Loizzi V, Chan JK, Osann K, Cappuccini F, DiSaia PJ, Berman ML (2003) Survival outcomes in patients with recurrent ovarian cancer who were treated with chemoresistance assay-guided chemotherapy. Am J Obstet Gynecol. 189: 1301-7.
FIGURE 1
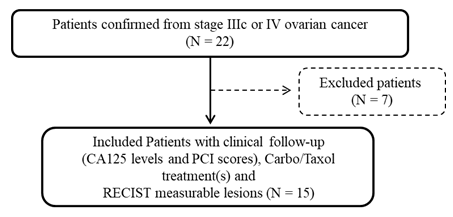
Figure 1: Flow chart showing the patient selection process
Tables at a glance
Figures at a glance