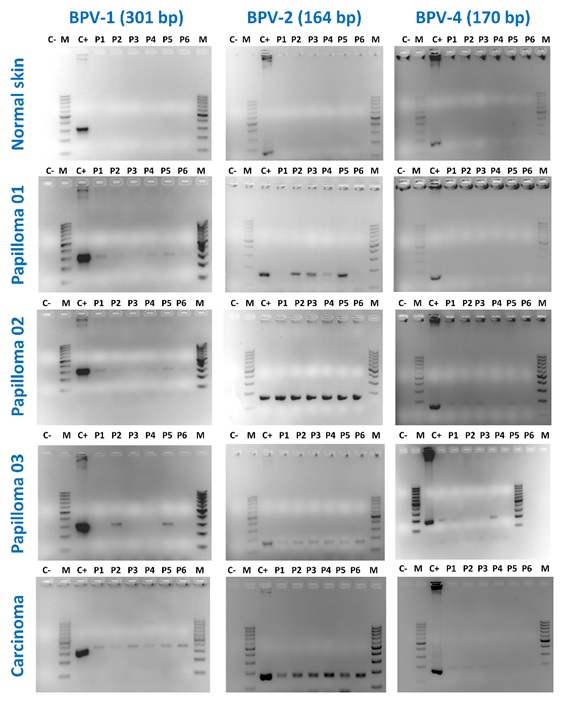
Figure 1 BPV DNA sequences identified by PCR
Figure 1 BPV DNA sequences identified by PCR
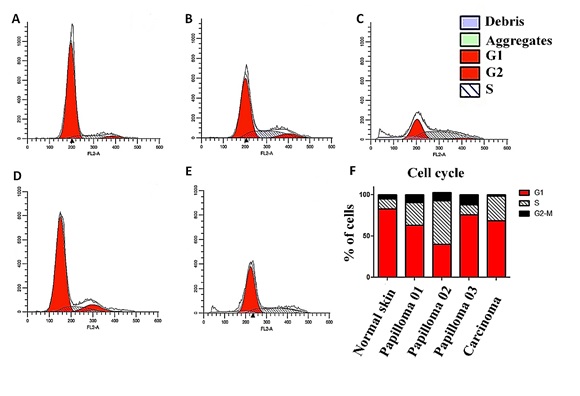
Figure 2 Cell cycle analysis by flow cytometry: normal skin (A), papilloma 01 (B), 02 (C), 03 (D), esophageal carcinoma (E) and cell cycle distribution (F). Results show a cell percentage increase in S (synthesis) and G2-M in all primary cultures derived from BPV-infected lesions in relation to BPV-free normal skin cells.
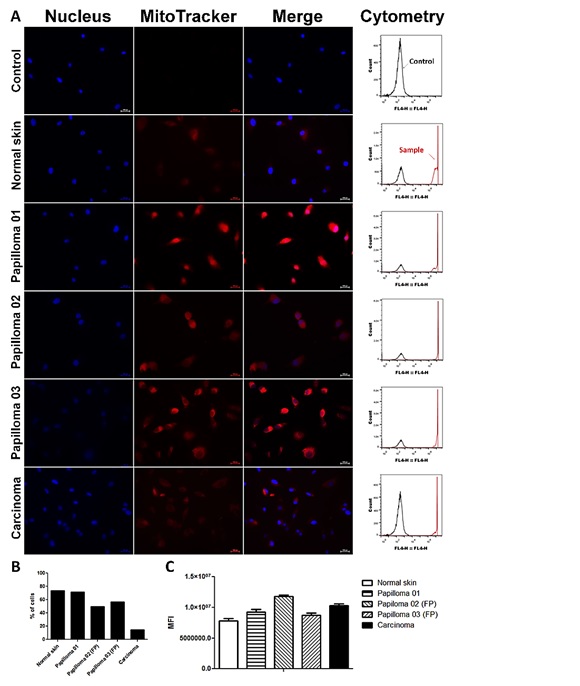
Figure 3 Analysis of BPV action on mitochondrial membrane potential (??m) deregulation by immunofluorescence and flow cytometry (FC):
A) control presenting absence of fluorescent signal in cutaneous papilloma cell line not treated with MitoTracker probe, MitoTracker labelling in normal skin, papillomas and esophageal carcinoma cells in second passage. Histograms based on cell percentage labelled with MitoTracker probe (B) and the median of fluorescent intensity (MFI) + standard deviation (C). Results show a reduction in cell percentage with oxidative metabolism in fibropapilloma (FP) and esophageal carcinoma cell lines, suggesting the activation of aerobic glycoslysis. Bonferroni’s multiple comparison analysis based on MFI showed an increase in MFI of papilloma 02 and esophageal carcinoma cells, suggesting an energy compensatory mechanism.Total of 10,000 events analyzed. Scale bar of 100 µm. Flow cytometry graphs showing number of cells (Y axis) and fluorescent intensity in FL4 channel (X axis).
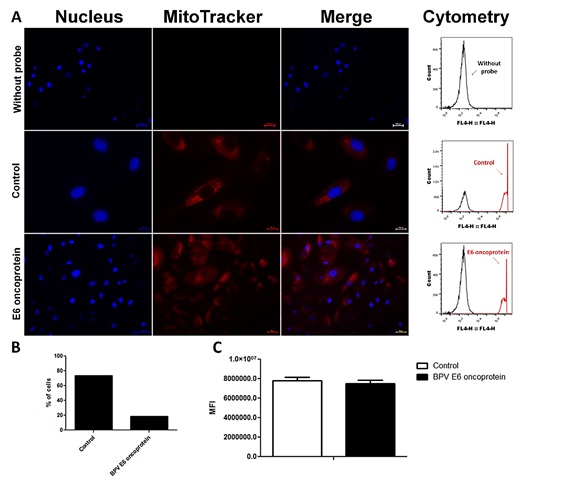
Figure 4 Analysis of BPV E6 oncoprotein on mitochondrial membrane potential (??m) deregulation by immunofluorescence and flow cytometry (FC).
A) negative control (without probe) presenting absence of fluorescent signal in cutaneous papilloma cell line not treated with MitoTracker probe; normal skin cell lines normal skin cell line (uninfected by BPV) and normal skin cell line treated with 1 µg/mL of BPV-1 E6 recombinant oncoprotein. Histogram based on cell percentage labelled with MitoTracker probe (B) and median of fluorescent intensity (MFI) + standard deviation (C). Results show a reduction of mitochondrial membrane potential after the treatment with BPV-1 E6 oncoprotein (B), however, without reduce the MFI (C) in cells expressing oxidative metabolism.
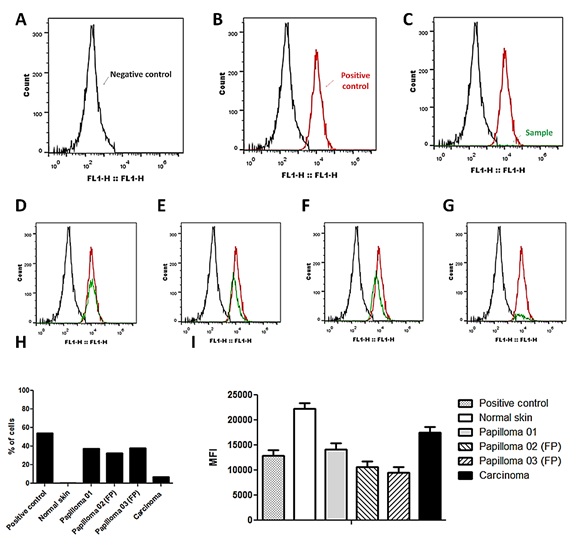
Figure 5 Levels of reactive oxygen species (ROS) observed on five cell lines.
A) flow cytometry showing absence of unspecific labelling in cutaneous papilloma cells not treated with the DCFH-DA probe (negative control) and ROS production in: B) normal skin cells treated with 1 mM of H2O2 and incubated with probe (positive control), C) normal skin, D) cutaneous papilloma 01, E) papilloma 02 (FP – fibropapilloma), F) papilloma 03 (FP – fibropapilloma) and G) esophageal carcinoma cells. Histograms based on cell percentage labelled with DCFH-DA probe (H) and median of fluorescent intensity (MFI) + standard deviation (I). Results show that the normal skin cells presented the highest ROS production, verified by the mean of fluorescence intensity (MFI) (I), but restricted a fewest number of cells (H). Papillomas cells showed intermediate levels of ROS (I), but in a high cell percentage, reinforcing the energy compensatory mechanism. Total of 10,000 events analyzed. Scale bar of 100 µm. Flow cytometry graphs showing number of cells (Y axis) and fluorescent intensity in FL1 channel (X axis). Cells analyzed in second passage (P2).
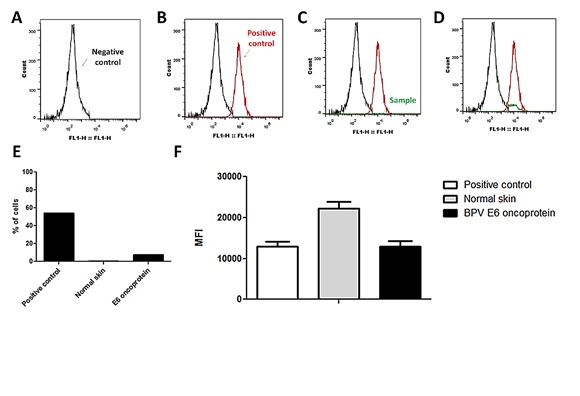
Figure 6 Levels of reactive oxygen species (ROS) observed after E6 oncoprotein addition.
A) normal skin cell line (uninfected by BPV) not incubated with DCFH-DA probe (negative control), showing absence of labelling, B) normal skin cell line treated with 1 mM of H2O2 and incubated with probe, showing ROS formation (positive control), C) normal skin cell line only incubated with probe, showing reduced ROS production as a consequence of normal oxidative metabolis, D) normal skin cell line treated with 1 µg/mL of BPV-1 E6 recombinant oncoprotein. Histogram based on ROS-producing cell percentage (E) and median of fluorescent intensity (MFI) + standard deviation (F). Results show an increase in ROS production in cells treated with BPV-1 E6 oncoprotein. Total of 10,000 events analyzed. Scale bar of 100 µm. Flow cytometry graphs showing number of cells (Y axis) and fluorescent intensity in FL1 channel (X axis). Cells analyzed in second passage (P2).
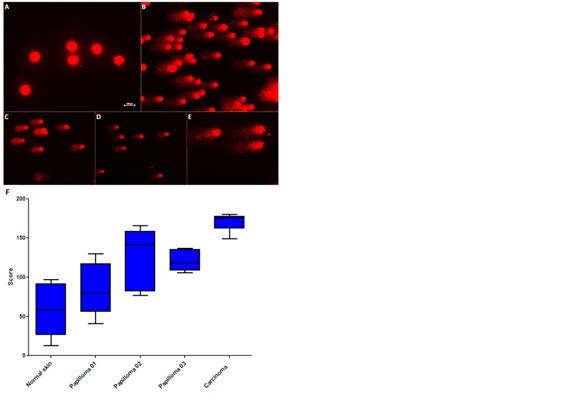
Figure 7 Analysis of clastogenic potential of BPV by comet assay.
A) nucleoids showing absence of DNA damage (class 0) observed in normal skin (uninfected by BPV), nucleoids showing maximum level of DNA damage (class 2), observed in cutaneous papilloma 01 (B), 02 (C), 03 (D) and esophageal carcinoma cell lines (F). G) Boxplot showing maximum, minimum and median of comet scores, demonstrating high levels of clastogenesis in esophageal carcinoma cell line.
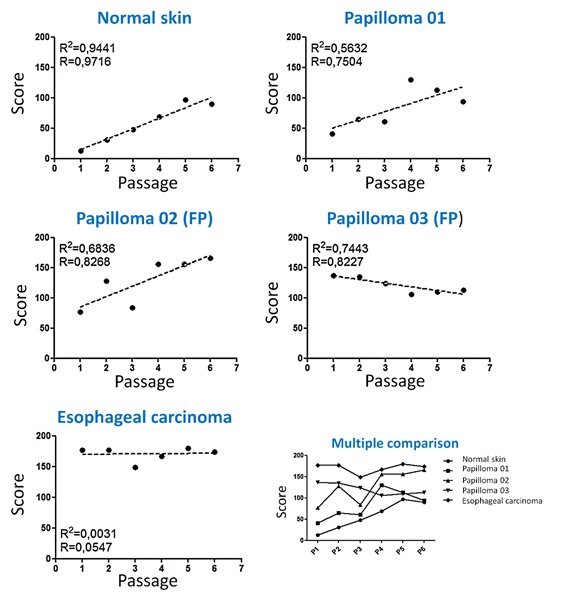
Figure 8 Linear regression of comet score
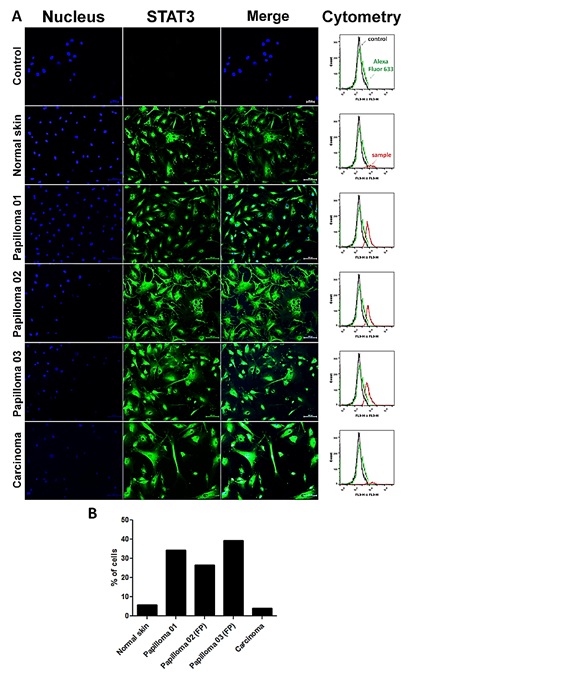
Figure 9 Analysis of STAT3 Y705 expression.
A) photomicrograph and flow cytometry showing absence of unspecific labelling in cutaneous papilloma cell line only treated with secondary antibody (Alexa Fluor 633) (control) and normal skin cells not treated with any antibody. Results show the immunodetection of STAT3 activated in nucleus of cutaneous papilloma (papilloma 01), fibropapilloma (papilloma 02 and 03) and esophageal carcinoma, but not in normal skin cells. Histograms based on STAT3 Y705-expressing cell percentage (B) Results show a high STAT3-expressing cell percentage in both papilloma and fibropapilloma (FP) cells. Esophageal carcinoma and normal skin cells show the similar levels of expression of STAT3, however, it is verified the nuclear immunodetection of STAT3 in esophageal carcinoma, indicating the activation of this nuclear transcription factor. Total of 10,000 analyzed events. FP – fibropapilloma. Scale bar of 100 µm. Flow cytometry graphs showing number of cells (Y axis) and fluorescent intensity in FL1 channel (X axis).
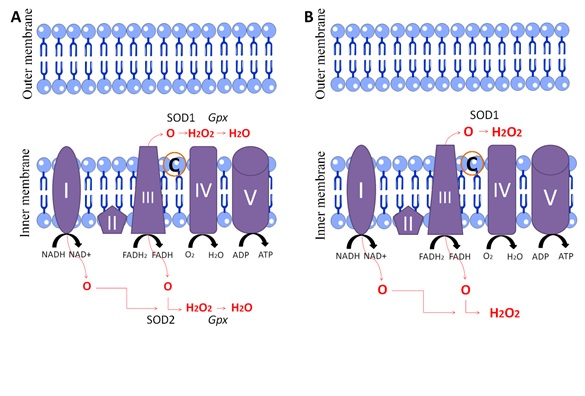
Figure 10 Downregulation of SOD2 and GPx antioxidant enzymes
A) Under normal conditions, the singlet oxygen produced by the mitochondrial complex is converted to hydrogen peroxide by the superoxide dismutase 1 (SOD1) or 2 (SOD2) and, the hydrogen peroxide is converted to water molecule by the GPx enzyme. B) However, the E6 oncoprotein expression leads to the SOD2 and GPx downregulation, reducing the catalysis of singlet oxygen and hydrogen peroxide (ROS). However the electron flux is conserved, avoiding the cytochrome c release and, therefore, conferring an anti-apoptotic stimulus.
Normal skin |
||||
Passage |
Class 0 |
Class 1 |
Class 2 |
Score |
P1 |
90 |
7 |
3 |
13 |
P2 |
79 |
11 |
10 |
31 |
P3 |
74 |
4 |
22 |
48 |
P4 |
61 |
9 |
30 |
69 |
P5 |
48 |
7 |
45 |
97 |
P6 |
52 |
6 |
42 |
90 |
Total |
404 |
44 |
152 |
348 |
Cutaneous papilloma 01 |
||||
Passage |
Class 0 |
Class 1 |
Class 2 |
Score |
P1 |
79 |
1 |
20 |
41 |
P2 |
65 |
5 |
30 |
65 |
P3 |
68 |
3 |
29 |
61 |
P4 |
29 |
12 |
59 |
130 |
P5 |
35 |
17 |
48 |
113 |
P6 |
53 |
12 |
41 |
94 |
Total |
329 |
50 |
227 |
504 |
Cutaneous papilloma 02 |
||||
Passage |
Class 0 |
Class 1 |
Class 2 |
Score |
P1 |
58 |
7 |
35 |
77 |
P2 |
30 |
12 |
58 |
128 |
P3 |
47 |
22 |
31 |
84 |
P4 |
8 |
28 |
64 |
156 |
P5 |
87 |
18 |
69 |
156 |
P6 |
7 |
20 |
73 |
166 |
Total |
237 |
107 |
330 |
767 |
Cutaneous papilloma 03 |
||||
Passage |
Class 0 |
Class 1 |
Class 2 |
Score |
P1 |
26 |
11 |
63 |
137 |
P2 |
24 |
17 |
59 |
135 |
P3 |
32 |
12 |
56 |
124 |
P4 |
39 |
16 |
45 |
106 |
P5 |
35 |
20 |
45 |
110 |
P6 |
25 |
37 |
38 |
113 |
Total |
181 |
113 |
306 |
725 |
Esophageal carcinoma |
||||
Passage |
Class 0 |
Class 1 |
Class 2 |
Score |
P1 |
2 |
19 |
79 |
177 |
P2 |
1 |
21 |
78 |
177 |
P3 |
12 |
27 |
61 |
149 |
P4 |
5 |
23 |
72 |
167 |
P5 |
3 |
14 |
83 |
180 |
P6 |
4 |
18 |
78 |
174 |
Total |
27 |
122 |
451 |
1,024 |
Table1 Comet assay results
Comparition |
Post difference |
Z calculated |
Critical Z |
p |
Normal skin and Papilloma 01 |
3.9167 |
0.7706 |
2.807 |
ns |
Normal skin and Papilloma 02 |
11.8333 |
2.3282 |
2.807 |
ns |
Normal skin and Papilloma 03 |
10.7500 |
2.1150 |
2.807 |
ns |
Normal skin and esophageal carcinoma |
21.0000 |
4.1317 |
2.807 |
< 0.05 |
Papilloma 01 and Papilloma 02 |
7.9167 |
1.5576 |
2.807 |
ns |
Papilloma 01 and Papilloma 03 |
6.8333 |
1.3444 |
2.807 |
ns |
Papilloma 01 and esophageal carcinoma |
17.0833 |
3.3611 |
2.807 |
< 0.05 |
Papilloma 02 and Papilloma 03 |
1.0833 |
0.2131 |
2.807 |
ns |
Papilloma 02 and esophageal carcinoma |
9.1667 |
1.8035 |
2.807 |
ns |
Papilloma 03 and esophageal carcinoma |
10.2500 |
2.0167 |
2.807 |
ns |
Table2 Results of post hoc Dunn test
ns – non significative statiscal difference
Passage |
Normal skin |
Papilloma 01 |
Papilloma 02 |
Papilloma 03 |
Esophageal carcinoma |
P1 |
13Ş* |
41Ş |
77Ş,b |
137Ş,b |
177b |
P2 |
31Ş |
65Ş |
128Ş,b |
135Ş,b |
177b |
P3 |
48Ş |
61Ş |
84Ş,b |
124Ş,b |
149b |
P4 |
69Ş |
130Ş |
156Ş,b |
106Ş,b |
167b |
P5 |
97Ş |
113Ş |
156Ş,b |
110Ş,b |
180b |
P6 |
90Ş |
94Ş |
166Ş,b |
113Ş,b |
174b |
Table3 Statistical results of comet assay
*numbers followed by equal letters indicate the absence of significate statistical differences