|
Number |
Number |
4X TGT |
TGD |
|
P value (t-test) |
|
|
of mice |
of death |
(day) |
(day) |
|
|
|
|
Control |
12mg/kg |
|
|
|
|
|
|
20mg/kg |
|
|
Untreated Control |
7 |
|
3.5 ± 0.6 |
|
|
|
|
|
|
|
|
|
|
|
|
12 mg/kg, QD x 5 |
6 |
|
4.9 ± 0.4 |
1.3 ± 0.4 |
<0.01 |
|
|
|
|
|
|
|
|
|
|
20 mg/kg, QOD x |
7 |
|
4.9 ± 1.0 |
1.3 ± 1.0 |
0.01 |
1.0 |
|
3 |
|
|
|
|
|
|
|
|
|
|
|
|
|
|
|
60 mg/kg, one |
7 |
2 |
5.0 ± 0.3 |
1.5 ± 0.3 |
<0.01 |
0.5 |
0.7 |
dose |
|
|
|
|
|
|
|
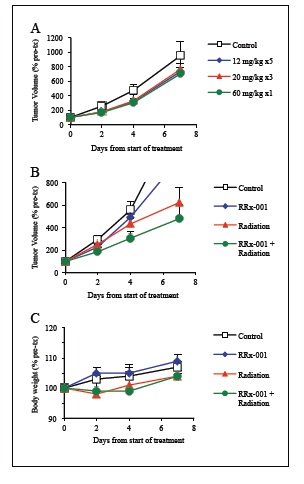
A. Oral RRx-001 alone
|
Number |
4X TGT |
TGD |
|
P value (t-test) |
|
|
of mice |
(day) |
(day) |
|
|
|
|
Control |
RRx-001 |
|
|
|
|
|
Radiation |
|
|
Untreated Control |
7 |
3.0 ± 0.3 |
|
|
|
|
|
|
|
|
|
|
|
RRx-001 10mg/kg QD x 5 |
7 |
3.5 ± 0.4 |
0.5 ± 0.4 |
0.01 |
|
|
|
|
|
|
|
|
|
Radiation 250cGy daily x 5 |
7 |
3.9 ± 0.7 |
0.9 ± 0.7 |
0.01 |
0.3 |
|
|
|
|
|
|
|
|
RRx-001 + Radiation |
7 |
6.1 ± 1.8 |
3.1 ± 1.8 |
<0.01 |
0.01 |
0.02 |
B. Combination of RRx-001 and radiation
Table 1: Tumor growth delay time of SCC VII tumors in mice