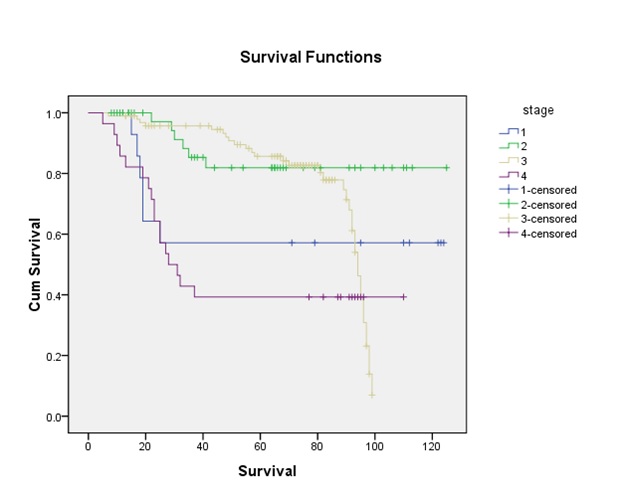
Figure 1 Comparison of OS among AJCC stages. OS, overall survival; AJCC, American Joint Committee on Cancer
Figure 1 Comparison of OS among AJCC stages. OS, overall survival; AJCC, American Joint Committee on Cancer
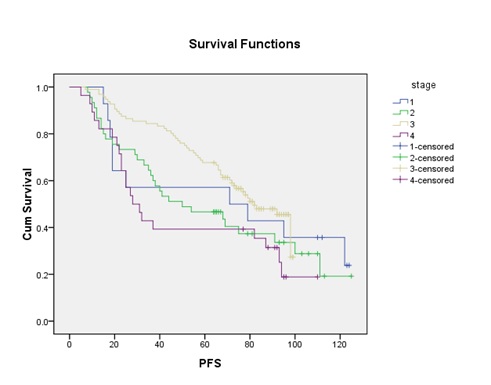
Figure 2 Comparison of PFS among AJCC stages. PFS, progression free survival; AJCC, American Joint Committee on Cancer
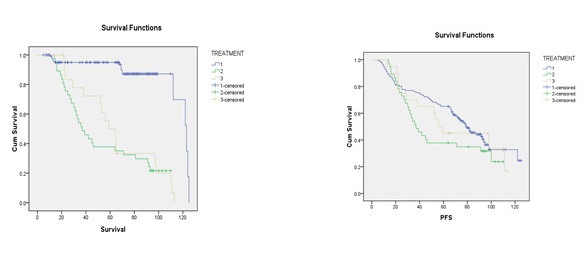
Figure 3 Comparison of OS (A) and PFS (B) between the treatment methods in stage I-II. OS, overall survival; PFS progression-free survival.
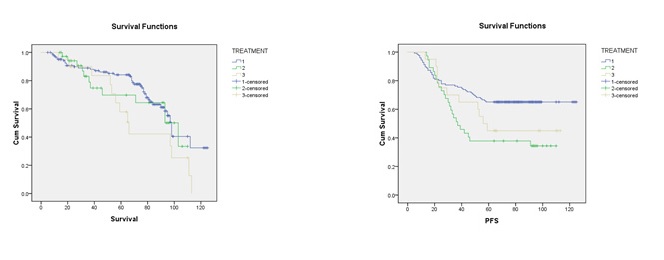
Figure 4 Comparison of OS (A) and PFS between the treatment methods in stage III. OS, overall survival; PFS, progression-free survival.
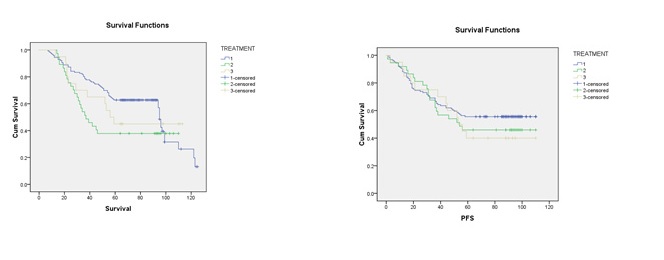
Figure 5 Comparison of OS (A) and PFS between the treatment methods in stage IV. OS, overall survival; PFS, progression-free survival.
| Characteristics | Number | % |
| Age(year) | 47.94±13.250 | |
| Range 1 2-85 | ||
| Median | 48. 00 | |
| Male: Female | 13 5:48 | |
| Histology | ||
| WHOType I | 20 | 10.9 |
| WHOType II | 41 | 22.4 |
| WHOType III | 122 | 6.7 |
| Stage(AJCC2010) | ||
| StageI | 15 | 8.2 |
| StageII | 45 | 24.6 |
| StageIII | 96 | 52.5 |
| StageIV | 27 | 14.8 |
| T Classification | ||
| T1 | 35 | 19.1 |
| T2 | 73 | 39.9 |
| T3 | 56 | 30.6 |
| T4 | 19 | 10.4 |
| N Classification | ||
| N0 | 43 | 23.5 |
| N1 | 83 | 45.4 |
| N2 | 48 | 26.2 |
| N3 | 9 | 4.9 |
| M Classification | ||
| M0 | 178 | 97.3 |
| M1 | 5 | 2.7 |
| Primary Treatment | ||
| RT | 20 | 11. 0 |
| NAC+RT+CCRT | 14 | 24. 0 |
| CCRT+RT+AC | 119 | 65. 0 |
Table 1:AJCC, America Joint Committee on Cancer; RT, Radiotherapy, NAC, Neo-adjuvant Chemotherapy, CCRT, Concurrent Chemotherapy
| Univariate analysis of prognostic factors for OS and PFS | |||||||
| Factors | n() | 5-year OS rate(%) | x2 | *P value | 5year PFS rate(%) | x2 | *P value |
| Age-group | 103 | 58.3 | 5.208 | 0.022 | 53.4 | 4.773 | 0.029 |
| <50 | 80 | 41.3 | 32.5 | ||||
| 50 and above | |||||||
| Gender | |||||||
| Male | 135 | 43.8 | 4.15 | 0.042 | 39.6 | 4.38 | 0.036 |
| Female | 48 | 60.3 | 59.3 | ||||
| Stage (AJCC 2014) | |||||||
| Stage I | 15 | 66.7 | 9.275 | 0.026 | 60. 0 | 8.103 | 0.044 |
| Stage I I | 45 | 55.6 | 51.1 | ||||
| Stage I I I | 96 | 41.8 | 36.6 | ||||
| Stage IV | 27 | 25.9 | 18.6 | ||||
| T classification | |||||||
| T1 | 35 | 57.1 | 9.119 | 0.028 | 51.4 | 9.737 | 0.021 |
| T2 | 73 | 54.4 | 50.7 | ||||
| T3 | 56 | 41.4 | 35.7 | ||||
| T4 | 19 | 21.3 | 15.8 | ||||
| M classification | |||||||
| M0 | 178 | 50.6 | 4.975 | 0.026 | 48.3 | 4.558 | 0.035 |
| M1 | 5 | 0. 00 | 0. 00 | ||||
| Primary treatment | |||||||
| RT | 20 | 42.1 | 8.921 | 0.012 | 36.8 | 10.5 | 0.005 |
| NAC+RT+CCRT | 44 | 50.4 | 45.5 | ||||
| CCRT+RT+AC | 119 | 69.7 | 67.2 | ||||
| Treatment | Effects | ||||||
| NC | 11 | 9.1 | 16.567 | 0.001 | 0 .0 | 20.061 | 0. 000 |
| PD | 14 | 14.4 | 7.1 | ||||
| PR | 34 | 47.1 | 41.2 | ||||
| CR | 124 | 56.5 | 52.4 | ||||
Table 2: AJCC, America Joint Committee on Cancer; RT, Radiotherapy, NAC, Neo-adjuvant Chemotherapy; AC, Adjuvant Chemotherapy, CCRT, Concurrent Chemotherapy; CR, complete response; PR , partial response; NC, no change; PD, progression disease; OS, overall survival; PFS, progression free survival
| Variable | Patients | Hazard ratio | 95% CI | *P value | Hazard ratio | 95% CI | *P value |
| Age group <50 | 103 | 1.12 | 1.41- 3.82 | 0.043 | 2.052 | 1.20-3.05 | 0.017 |
| 50 and above | 80 | ||||||
| Gender | |||||||
| Male | 135 | 0.35 | 0.147-0.817 | 0.01 | 0.383 | 0.189-0.776 | 0.07 |
| Female | 48 | ||||||
| Histology | |||||||
| WHO Type I | 20 | 2.57 | 0.841-1.853 | 0.088 | 1.408 | 0.667-2.969 | 0.368 |
| WHO Type II | 41 | ||||||
| WHO Type III | 122 | ||||||
| Stage (AJCC 2010) | |||||||
| Stage I | 15 | 0.748 | 0.317-1.764 | 0.034 | 1.008 | 0.502-2.025 | 0.029 |
| Stage II | 45 | ||||||
| Stage III | 96 | ||||||
| Stage IV | 27 | ||||||
| T classification | |||||||
| T1 | 35 | 1.427 | 0.610-3.337 | 0.025 | 1.05 | 0.54-2.039 | 0. 000 |
| T2 | 73 | ||||||
| T3 | 56 | ||||||
| T4 | 19 | ||||||
| N classification | |||||||
| N0 | 43 | 0.904 | 0.464-1.758 | 0.765 | 1.232 | 0.622-2.437 | 0.547 |
| N1 | 83 | ||||||
| N2 | 48 | ||||||
| N2 | 9 | ||||||
| M classification | |||||||
| M0 | 178 | 4.278 | 0.679-26.940 | 0.019 | 4.304 | 0.697-26.576 | 0.046 |
| M1 | |||||||
| Primary treatment | |||||||
| RT | 20 | 2.114 | 1.123 -3.978 | 0. 000 | 0.636 | 0.322-1.254 | 0.01 0 |
| NAC+RT+CCRT | 44 | ||||||
| CCRT+RT+CCRT | 119 | ||||||
| Treatment Effects | |||||||
| NC | 14 | 1.165 | 0.611-2.224 | 0.004 | 1.364 | 0.696- 2.674 | 0.03 0 |
| PD | 17 | ||||||
| PR | 34 | ||||||
| CR | 118 |
AJCC, America Joint Committee on Cancer; RT, Radiotherapy, NAC, Neo-adjuvant Chemotherapy, CCRT, Concurrent Chemotherapy; CR, complete response; PR , partial response; NC, no change; PD, progression disease; OS, overall survival; PFS, progression free-survival; CI, confidence interval.
| Factors | N=183 | RT(n=20) | NAC+RT+CCRT(n=44) | CCRT+RT+AC(n=119) | x2 | *P value |
| Age group | ||||||
| Less than 50 | 103 | 13 | 20 | 65 | 1.961 | 0.375 |
| 50 and above | 80 | 7 | 23 | 54 | ||
| Gender | ||||||
| Male | 135 | 10 | 34 | 91 | 1.201 | 0.319 |
| Female | 48 | 7 | 10 | 31 | ||
| Histology | ||||||
| WHO Type I | 20 | 1 | 5 | 14 | 3.374 | 0.497 |
| WHO Type II | 41 | 7 | 7 | 27 | ||
| WHO Type III | 122 | 12 | 32 | 78 | ||
| Stage(AJCC2010) | ||||||
| Stage I | 15 | 15 | 2 | 28 | 70.487 | 0. 000 |
| Stage II | 45 | 3 | 24 | 30 | ||
| Stage III | 96 | 1 | 2 | 47 | ||
| Stage IV | 27 | 1 | 16 | 14 | ||
| T classification | ||||||
| T1 | 35 | 15 | 2 | 28 | 49.873 | 0. 000 |
| T2 | 73 | 3 | 17 | 37 | ||
| T3 | 56 | 1 | 9 | 40 | ||
| T4 | 19 | 1 | 16 | 14 | ||
| M classification | ||||||
| M0 | 178 | 20 | 44 | 119 | 8.434 | 0 .004 |
| M1 | 5 | 1 | 4 |
Table 4: Characteristics of patients’ different primary treatment modalities
| OS rate (%) | PFS rate (%) | ||||||||||
| Variable No. of | RT | NAC+RT+CCRT | CCRT+RT+AC | RT | NAC+RT+ CCRT | C CRT+RT+AC | |||||
| Patients=183 | (n=20) | (n=44) | (n=119) | x2 | *P value | (n=20) | (n=44) | (n=119) | x2 | *P value | |
| Stage(AJCC2010) | |||||||||||
| Stage I | 60 | 34 | 58.3 | 62.7 | 62.451 | 0. 00 | 26.9 | 43.9 | 56 | 61.202 | 0. 000 |
| Stage II | 96 | 28.6 | 44.3 | 58.7 | 15. 0 | 36.1 | 50.2 | ||||
| Stage III | 27 | 0. 0 | 20. 0 | 36. 7 | 0. 0 | 10. 5 | 23. 6 | ||||
| T classification | |||||||||||
| T1 | 35 | 28.9 | 47.54 | 60 .0 | 0. 028 | 0.06 0 | 25.36 | 44.32 | 54.4 | 0.025 | 0.067 |
| T2 | 73 | 20.9 | 34.6 | 47.3 | 19.6 | 26 | 45.7 | ||||
| T3 | 59 | 17.1 | 26.1 | 45. 0 | 15.3 | 17.2 | 33.6 | ||||
| T4 | 19 | 5.26 | 22.9 | 44. 4 | 4.9 | 12.3 | 30 | ||||
| N classification | |||||||||||
| N0 | 43 | 39.2 | 44.4 | 52.1 | 0.165 | 0.059 | 30.2 | 38.3 | 47.8 | 0.122 | 0.07 0 |
| N1 | 83 | 30.2 | 38.6 | 46.9 | 28.3 | 23.3 | 46.5 | ||||
| N2 | 48 | 14.5 | 29.5 | 44.1 | 10.4 | 21.6 | 22.7 | ||||
| N3 | 9 | 8.3 | 11.1 | 12.6 | 1.2 | 2. 0 | 7. 6 | ||||
| M classification | |||||||||||
| M0 | 178 | 29.21 | 54.8 | 60.6 | 0.629 | 0.73 | 11.7 | 32.02 | 46.4 | 4.957 | 0.175 |
| M1 | 5 | 0 | 8. 87 | 10.2 | 0. 0 | 1.53 | 5. 70 | ||||
Table 5: Five year OS and PFS rates of different stages and treatment modalities