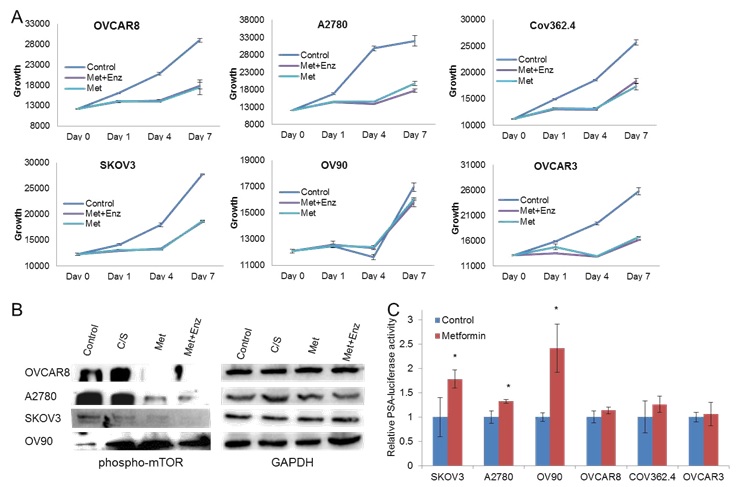
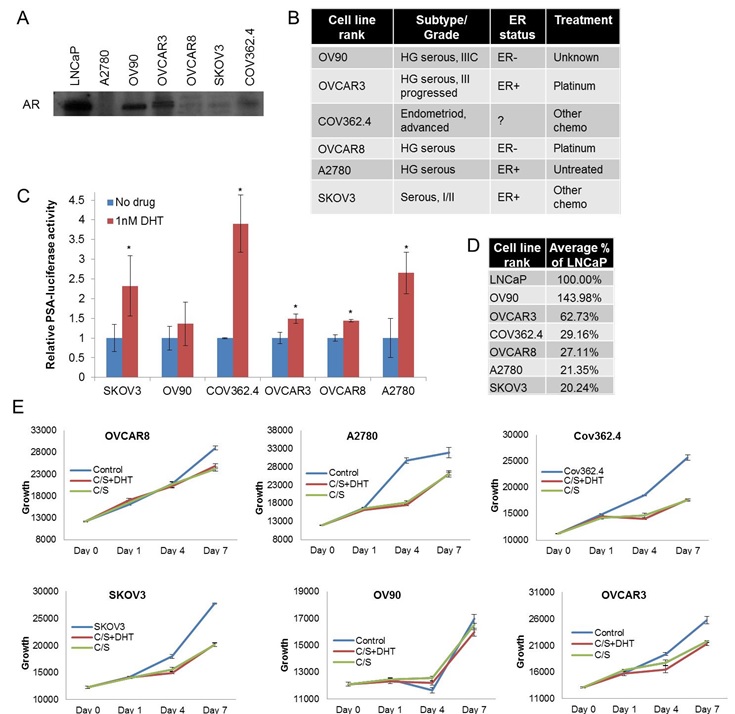
Figure 1 A) Western blot for AR expression. (B) Cell line information. (C) Cells were transfected with the androgen-responsive and control luciferase plasmids, treated with vehicle or DHT, and luciferase activity was quantified (* p<.05). (D) AR activity score of each cell line in comparison to LNCaP cells. (E) Cell growth was quantified following the indicated treatments *(C/S charcoal stripped FBS).

Figure 2 (A) Cell growth was quantified following the indicated treatments *(met= 10mM metformin, enz= 1uM enzalutamide). (B) Western blot for indicated proteins from cell lines treated with C/S serum, met, enz, or the combination. (C) Cells were transfected with the androgen-responsive and control luciferase plasmids, treated with vehicle or metformin, and luciferase activity was quantified (* p<.05).

Figure 3 (A) IHC median score and range for each histological subtype. (B) Example whole slide H&E and AR IHC staining (top) with 20x magnification AR staining (bottom) (C) AR IHC score plotted against the AR activity score for HG serous samples (D) Plot of AR activity score in samples with or without neoadjuvant chemotherapy exposure.