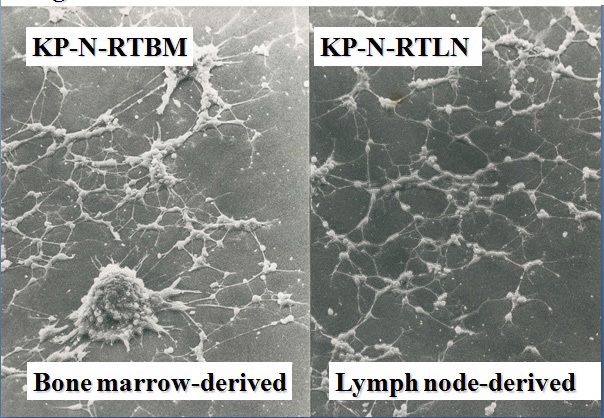
Figure 1 Establishment of the KP-N-RT NB cell line. KP-N-RTBM cells were derived from the bone marrow; KP-N-RTLN cells, lymph nodes
Figure 1 Establishment of the KP-N-RT NB cell line. KP-N-RTBM cells were derived from the bone marrow; KP-N-RTLN cells, lymph nodes
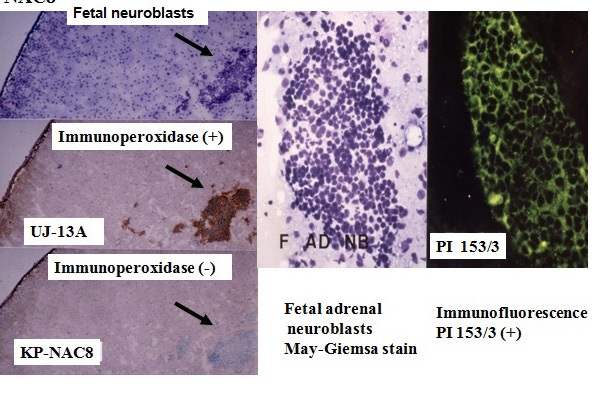
Figure 2 Cell surface membrane antigen on neuroblastoma (NB) cells, but not on fetal neuroblasts, on using the monoclonal antibody KP-NAC8.
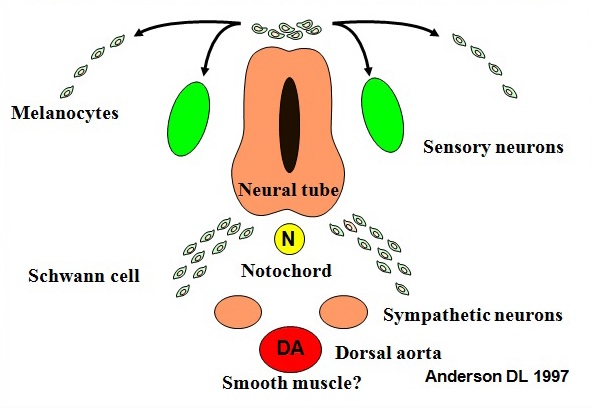
Figure 3 Derivatives of the neural crest in the trunk.
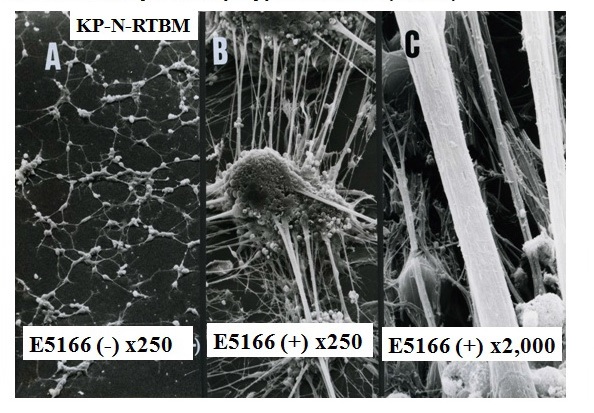
Figure 4 Neuronal Differentiation of KP-N-RT NB cells induced with synthetic polyprenoic acid (E5166).
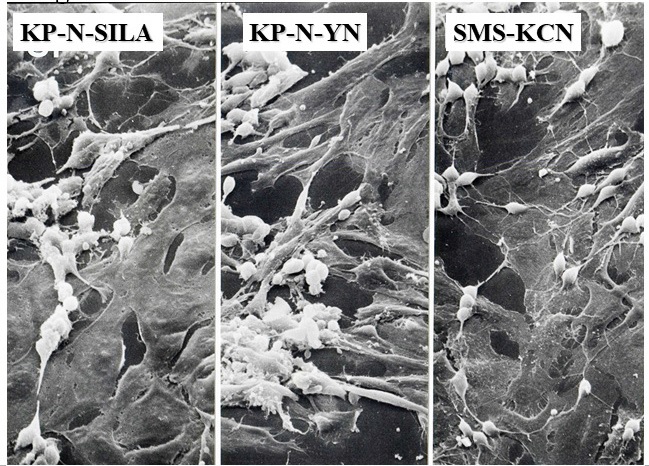
Figure 5 N- and S-cells in NB cell lines. During culturing, both spindle-shaped neurons and flat substrate-adhesive (S) cells were observed.
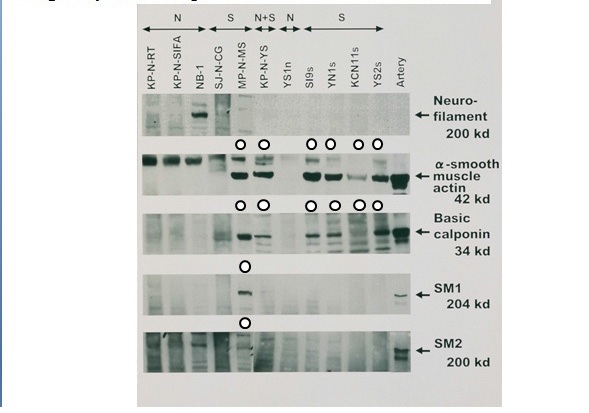
Figure 6 Cytoskeletal proteins of S-cells in NB cell lines (Western blot).
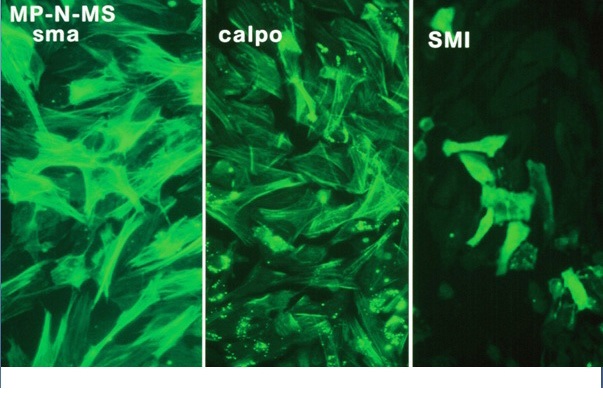
Figure 7 Cytoskeletal proteins in the MP-N-MS NB cell line.
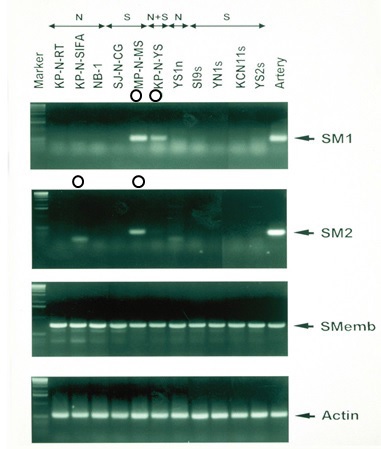
Figure 8 Myosin heavy chain in NB cell lines.
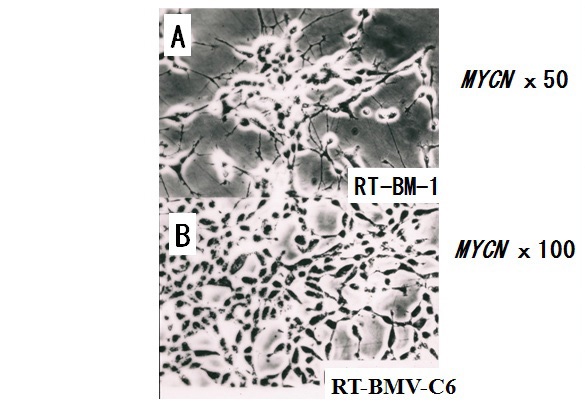
Figure 9 Subline RT-BM-1 and clone KT-BMV-C6 derived from the KP-N-RT NB cell line.
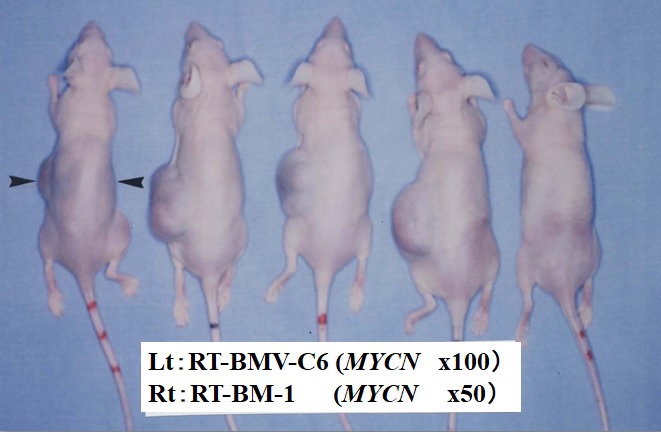
Figure 10 Inoculation of the RT-BMV-C6 (left flank) subline and the RT-BM-1 (right flank) parental cell line originating from the KP-N-RT NB cell line.
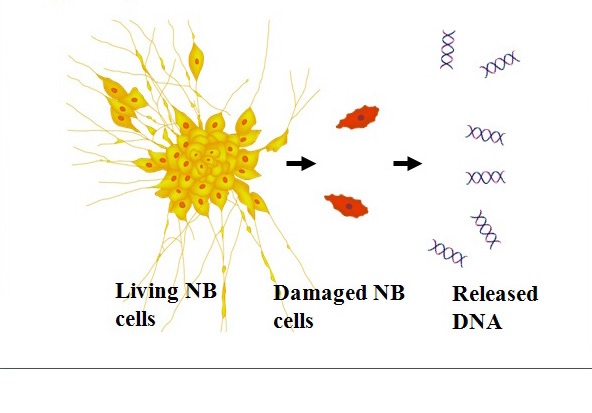
Figure 11Serum MYCN DNA predominantly originating from neuroblastoma-released DNA.
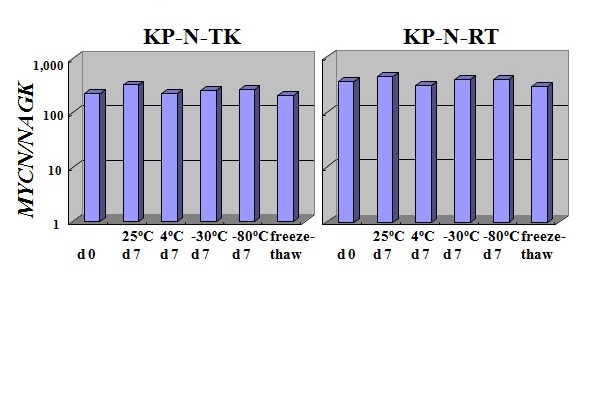
Figure 12 Stability of culture supernatant fluids in MYCN-amplified NB.
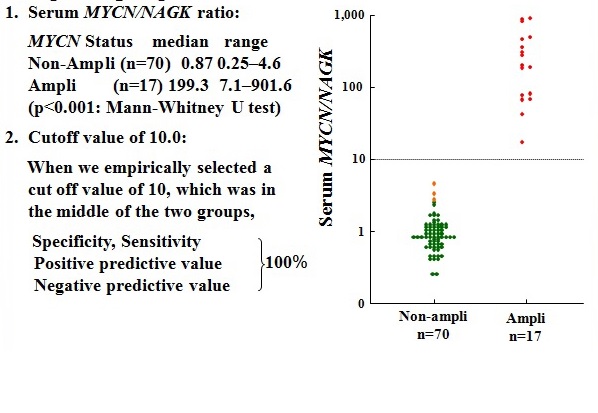
Figure 13 The serum MYCN/NAGK ratio in the MYCN-amplified group was significantly higher than that in the non-amplified groups.
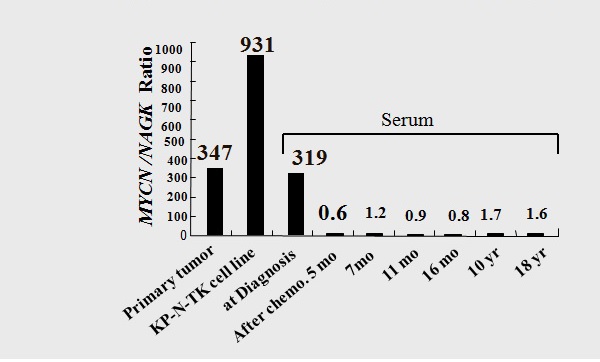
Figure 14 MYCN DNA levels in tumors of patient TK, the KP-N-TK cell line, and patient serum before and after chemotherapy, as determined via quantitative PCR analysis.
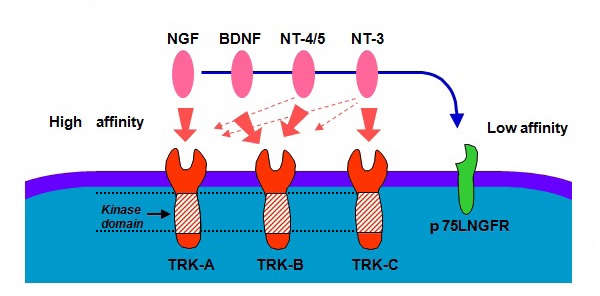
Figure 15 Association between tyrosine kinase family receptors with ligands.
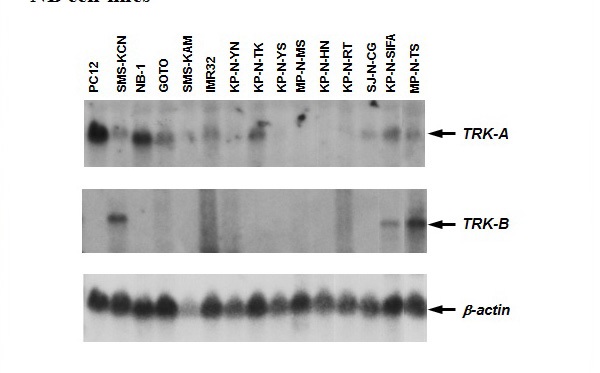
Figure 16 TRK-A and TRK-B expression in a panel of 14 NB cell lines.
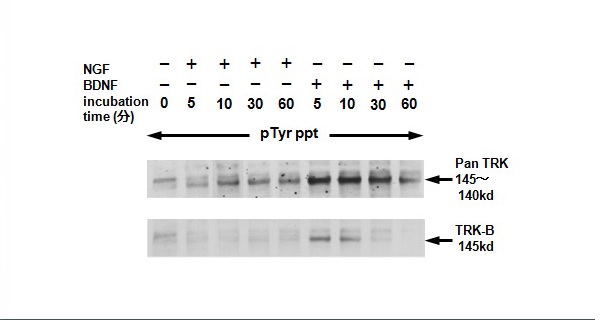
Figure 17 Time-course of tyrosine phosphorylation of panTRK and TRK-B receptor proteins with nerve growth factor and bone-derived neurotrophic factor in MP-N-TS NB cells.
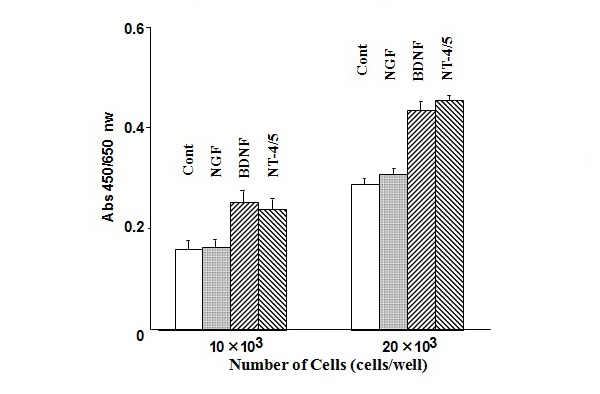
Figure 18 Effect of nerve growth factor, bone-derived neurotrophic factor, and neurotrophin-4/5 on cell viability in MP-N-TS NB cells.
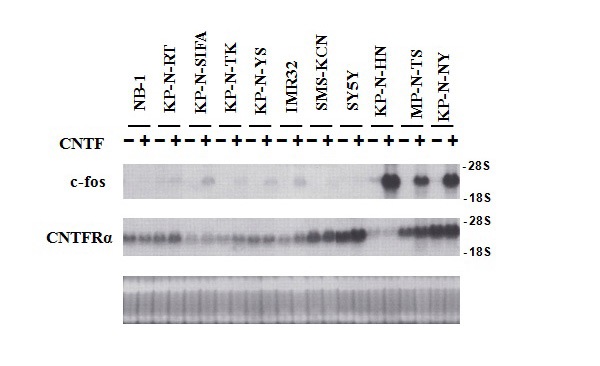
Figure 19 Induction of c-fos expression by ciliary neurotrophic factor in 11 NB cell lines.
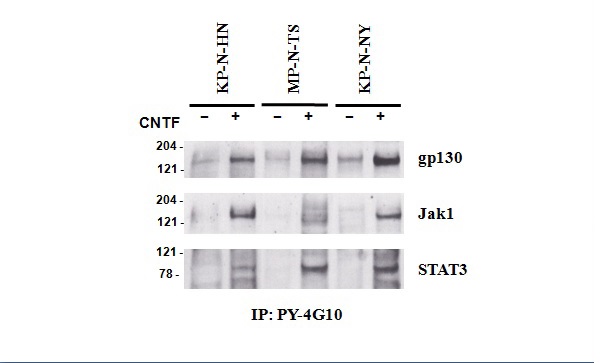
Figure 20 Tyrosine phosphorylation of gp130 Jak1 and STAT3 in KP-N-HN, MP-N-TS, and KP-N-NY NB cells.
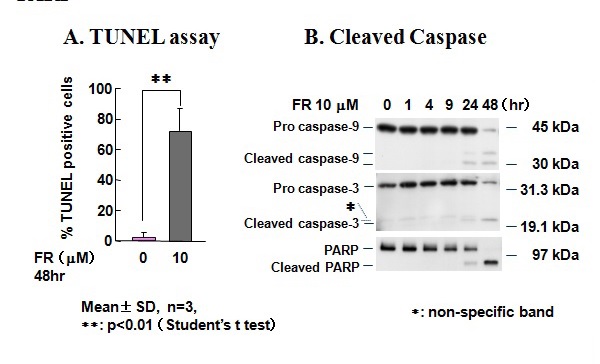
Figure 21 Fenretinide-induced apoptosis in KP-N-TK NB cells and the appearance of cleaved caspase-9, caspase-3, and PARP.
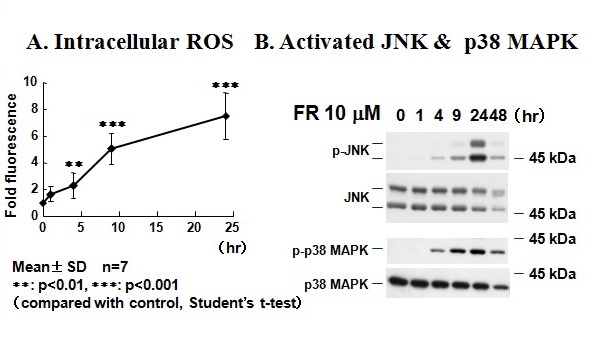
Figure 22Fenretinide-induced apoptosis, intracellular accumulation of reactive oxygen species, and activation of JNK and p38 MAPK in KP-N-TK NB cells.
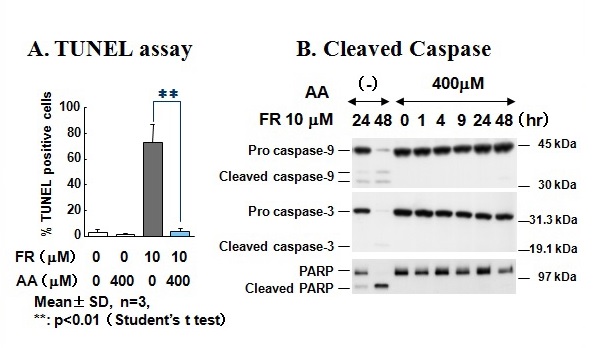
Figure 23 Fenretinide-induced processing of caspase-9, caspase-3, and PARP was suppressed in the presence of antioxidant L-ascorbic acid.
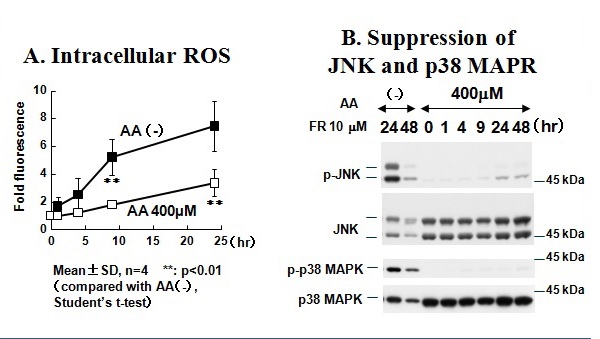
Figure 24Preincubation of KP-N-TK cells treated with ascorbic acid and fenretinide to suppress the accumulation of intracellular reactive oxygen species and suppression of JNK and p38 MAPR.
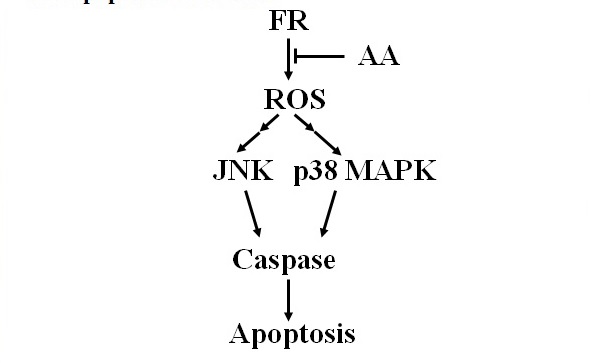
Figure 25 Fenretinide-induced production of reactive oxygen species, JNK signaling, p38 MAPK signaling, and apoptosis in NB cells.
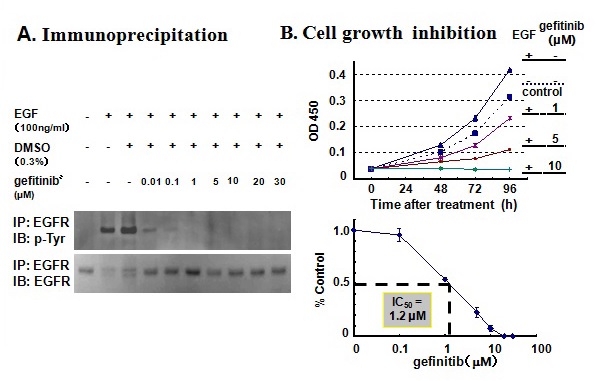
Figure 26 Inhibition of EGFR phosphorylation and inhibition of cell growth by gefitinib in KP-N-TK NB cells.
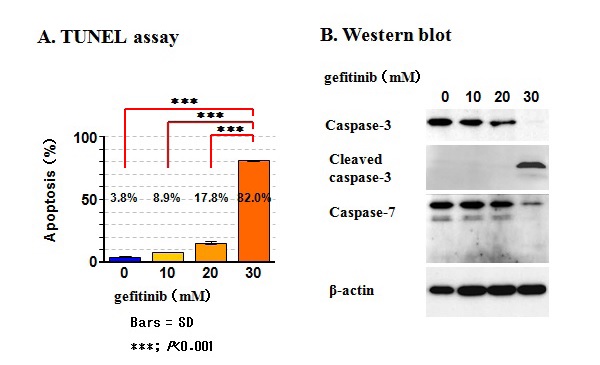
Figure 27 Induction of apoptosis by gefitinib in KP-N-TK NB cells.
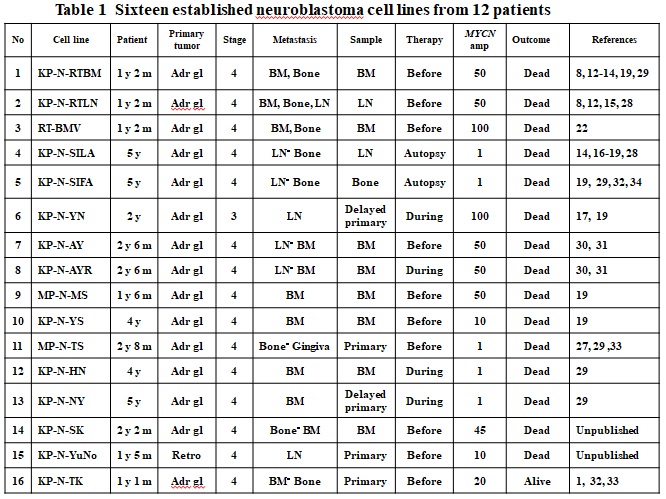
Table1 Sixteen established neuroblastoma cell lines from 12 patients
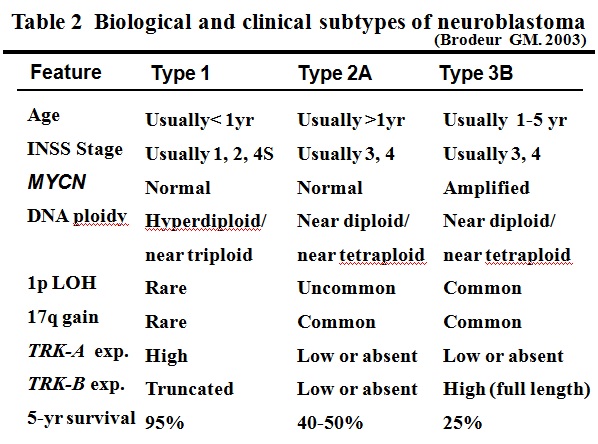
Table 2Biological and clinical subtypes of neuroblastoma
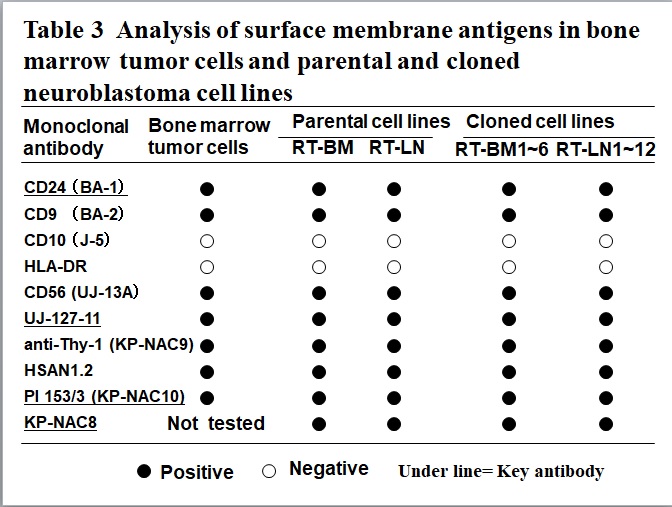
Table3 Analysis of surface membrane antigens in bone marrow tumor cells and parental and cloned neuroblastoma cell lines