Figure 1 Expression of MyoD1 in rhabdomyosarcoma, neuroblastoma, and other tumor cell lines
Figure 1 Expression of MyoD1 in rhabdomyosarcoma, neuroblastoma, and other tumor cell lines
Figure 2 PAX3/FKHR chimera gene in alveolar rhabdomyosarcoma cell lines
Figure 3 Cytoskeletal protein of SCMC-RM2 rhabdomyosarcoma cell line
Figure 4 MYCN-amplification (a) and expression (b) in SCMC-RM2 rhabdomyosarcoma cell line
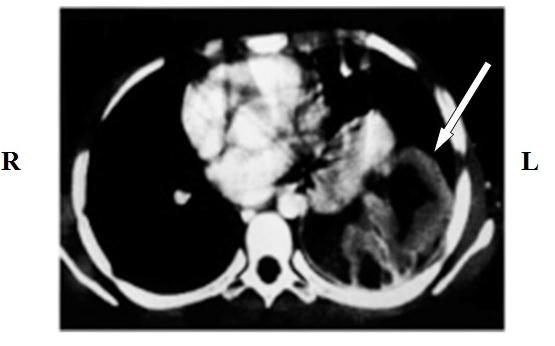
Figure 5 Establishment of the MP-ASKIN-SA cell line from the left pulmonary thoracopulmonary tumor from a 13 yr-old boy
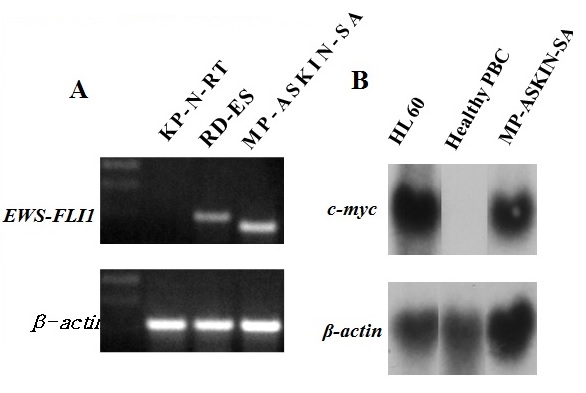
Figure 6 EWS/FLl1 chimera gene (a) and c-myc expression (b) in the MP-ASKIN-SA cell line
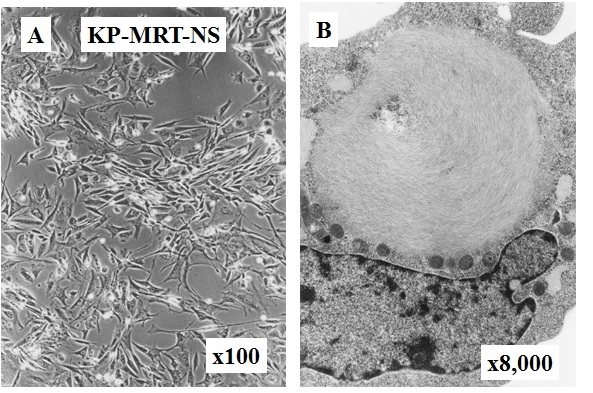
Figure 7 Inverted microscopic (a) and electron microscopic (b) analysis of the KP-MRT-NS cell line
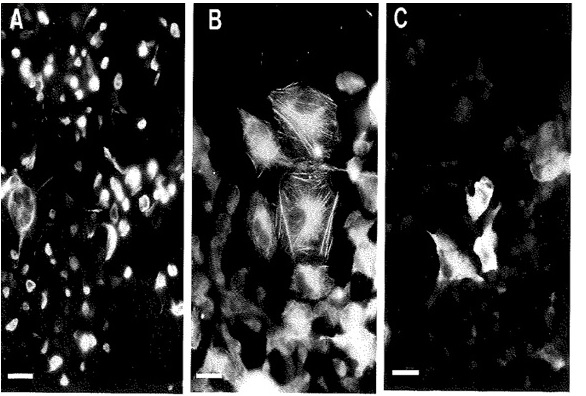
Figure 8 Indirect immunofluorescence with (a) neurofilament, (b) alpha-smooth-muscle actin, and (c) SM1 isoforms of the smooth-muscle-myosin heavy chain in the KP-MRT-NS cell line
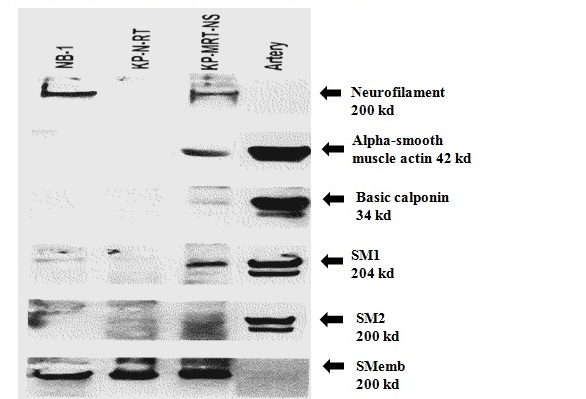
Figure 9 Western blot analysis of cytoplasmic proteins of KP-MRT-NS cell line with neurofilament, alpha-smooth-muscle, basic calponin and SM1 isoforms.
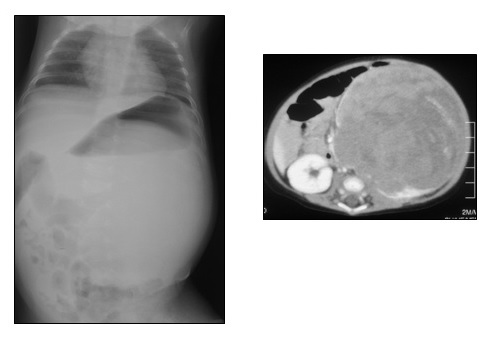
Figure 10 Chest XP and abdominal computed tomographic imaging of an established KP-MRT-RY cell line
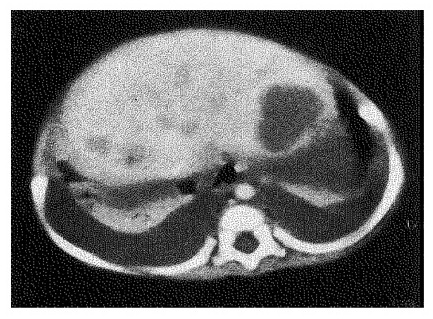
Figure 11Abdominal computed tomographic image showing massive pleural fluid and multiple hepatic tumor lesions in an established MP-MRT-AN cell line
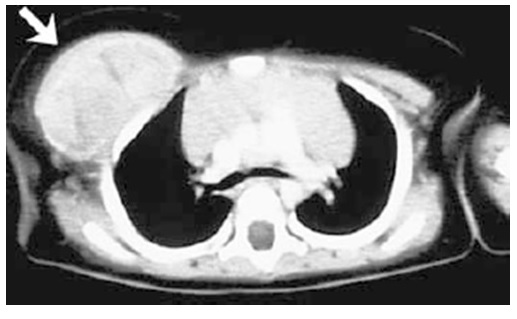
Figure 12 Chest computed tomographic image showing an enhanced thoracic mass on admission in an established KP-MRT-YM cell line
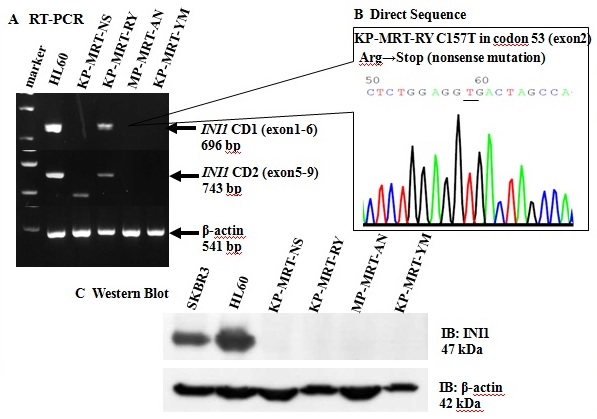
Figure 13 INI1 gene analysis in four MRT cell lines
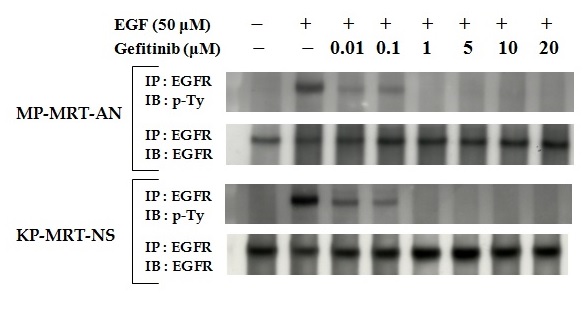
Figure 14 Effect of gefitinib on two MRT cell lines
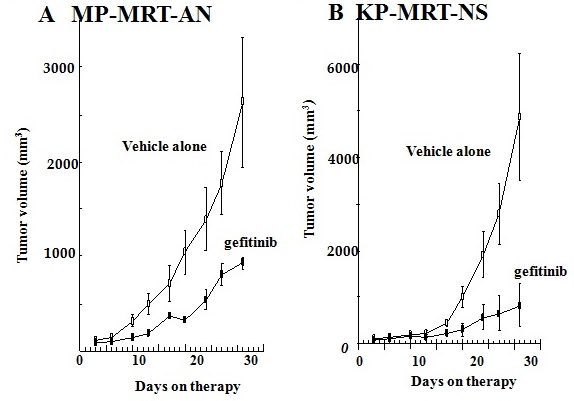
Figure 15 Inhibition of tumor growth by gefitinib in MRT cell lines
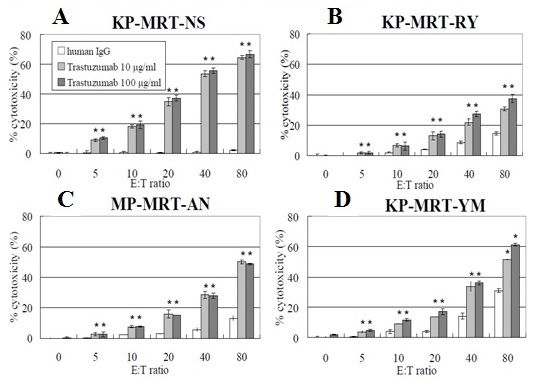
Figure 16 Trastuzumab enhances cytotoxicity against MRT cell lines using allogenic human peripheral blood mononuclear cells
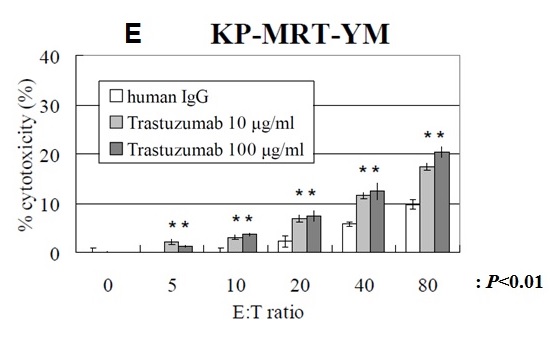
Figure 17 Trastuzumab enhances cytotoxicity against KP-MRT-YM cells
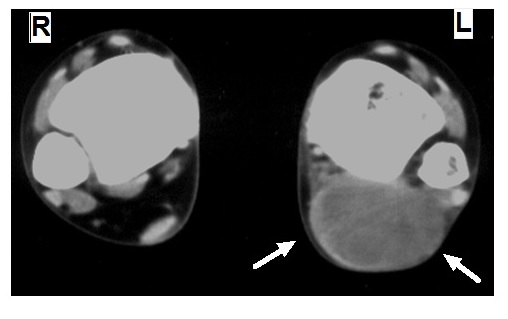
Figure 18 Enhanced computed tomography scan of left and right Achilles tendons of a patient with clear cell sarcoma of soft parts
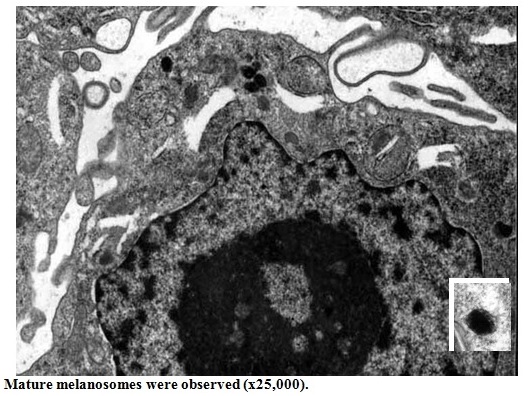
Figure 19 Electron microphotograph of MP-CCS-SY cell line
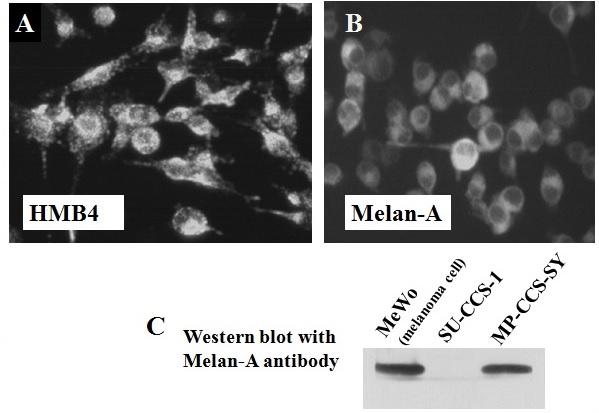
Figure 20 Immunofluorescence and western blot with HMB45 and Melan-A antibodies in MP-CCS-SY cell line
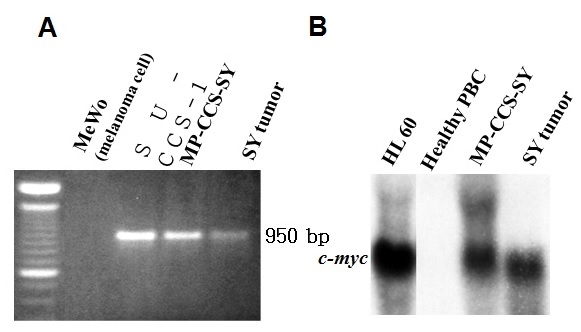
Figure 21 EWS/ATF1 chimeric gene (a) and c-myc mRNA in MP-CCS-SY cell line and SY tumor cells
No |
Cell line |
Age/gender |
Primary tumor |
Stage |
Culture Sample |
Outcome |
References |
Rhadomyosarcoma |
|||||||
1 |
SCMC-RM2 |
10y/F |
Rt-abdominal wall |
IV |
Bone marrow |
Dead |
11 |
2 |
KP-RMS-DH |
14y/M |
Lt-mandibular cavity |
IV |
Bone marrow |
Dead |
Unpublished |
3 |
KP-RMS-KH |
14/F |
Perinea |
IV |
Primary tumor |
Dead |
Unpublished |
Ewing sarcoma family tumor |
|||||||
1 |
KP-EW-YI |
16y/M |
Rt-pelvis |
II |
Primary tumor |
Dead |
17 |
2 |
KP-EW-MS |
16y/F |
Rt-breech |
IV |
Bone marrow |
Dead |
17 |
3 |
MP-ASKIN-SA |
13y/M |
Lt-chest |
II |
Primary tumor |
Dead |
18 |
4 |
KP-PNET-TO |
15y/M |
Lt-kidney |
IV |
L-iliac |
Dead |
Unpublished |
5 |
KP-EW-AK |
15y/M |
Lt-scapula |
IV |
Primary tumor |
Dead |
Unpublished |
Malignant rhabdoid tumor |
|||||||
1 |
KP-MRT-NS |
2m/F |
Lt-kidney |
II |
Ascites |
Dead |
19, 20, 24 |
2 |
KP-MRT-RY |
1m/M |
Lt-kidney |
I |
Primary tumor |
Dead |
19, 20, 22, 23 |
3 |
MP-MRT-AN |
3m/F |
liver |
IV |
Peripheral blood |
Dead |
20, 21, 24 |
4 |
KP-MRT-YM |
5m/M |
Rt-chest wall |
I |
Primary tumor |
Alive |
20, 22, 23 |
Clear cell sarcoma of soft parts |
|||||||
1 |
MP-CCS-SY |
13y/F |
Lt-Achillis |
II |
Lt-popliteall fossa |
Dead |
26, 28 |
Table1 Our established soft-tissue-sarcoma cell lines from children