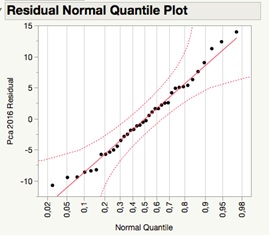
Figure 1 Q-Q plot in relation to PCa 2016 and quantile distribution of correlate variables.
Figure 1 Q-Q plot in relation to PCa 2016 and quantile distribution of correlate variables.
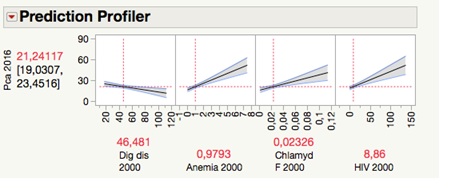
Figure 2 Prediction Profiler of the PCa correlated variables
Year |
Population males 106 |
CRD 103 for PCa |
||||
185 countries |
49 SC |
% of 49 SC |
185 countries |
49 SC |
% of 49 SC |
|
2000 |
3063.097 |
606.482 |
19.8 |
247.771 |
126.618 |
51.1 |
2016 |
3717.324 |
669.671 |
18.0 |
352.255 |
155.213 |
44.1 |
|
|
|
|
|
|
|
Year |
Population females 106 |
|||||
185 countries |
49 SC |
% of 49 SC |
||||
2000 |
3024.847 |
640.335 |
21.2 |
|||
2016 |
3673.749 |
738.321 |
20.1 |
|||
Table 1: Males Population and CRD for PCa in the 185 countries compared to the49 SC and relative percentages
Diseases |
GHE |
Gender M/F |
ASRDs values Mean ± SD |
% 2016 Vs 2000 |
||
2000 |
2010 |
2016 |
||||
Prostate cancer (PCa) |
740 |
M |
22.8 ± 16.11 |
22.5 ± 18.27 |
20.3 ± 15.55a |
-11.0 |
Iron-deficiency anemia [IDA] |
580 |
M |
0.89 ± 1.635 |
0.73 ± 1.714 |
0.56 ± 0.807 a |
-37.0 |
Infectious and parasitic diseases (InfPar Dis) |
20 |
M |
23.2 ± 29.01 |
16.0 ± 16.96 |
14.7 ± 16.43 a |
-41.7 |
Tuberculosis (TBC) |
30 |
M |
6.5 ± 10.31 |
3.4 ± 5.53 |
2.3 ± 3.26 a |
-64.6 |
STD (sexually transmitted diseases) excluding HIV |
40 |
M |
0.10 ± 0.163 |
0.05 ± 0.102 |
0.07 ± 0.201 |
-30.0 |
STD (sexually transmitted diseases) excluding HIV |
40 |
F |
0.23 ± 0.283 |
0.11 ± 0.143 |
0.09 ± 0.114 a |
-60.9 |
Syphilis |
50 |
M |
0.10 ± 0.162 |
0.06 ± 1.007a |
0.04 ± 0.073 a |
-40.0 |
Chlamydia (Chlamy) |
60 |
F |
0.02 ± 0.025 |
0.01 ± 0.014 |
0.01 ± 0.010 a |
-50.0 |
Gonorrhea (Gono) |
70 |
M |
0.003 ± 0.0039 |
0.001 ± 0.0015 |
0.001 ± 0.0008 a |
-66.7 |
HIV/AIDS |
100 |
M |
7.3 ± 22.44 |
6.5 ± 13.27 |
5.1 ± 13.62 |
-30.1 |
Diarrheal diseases (Diarrh) |
110 |
M |
2.7 ± 7.33 |
1.6 ± 3.29 |
1.4 ± 2.31 |
-48.1 |
Parasitic and vectorial diseases (PVD) |
210 |
M |
0.77 ± 1.953 |
0.49 ± 1.244 |
0.42 ± 0.957 a |
-45.5 |
Respiratory infections (R Inf) |
380 |
M |
31.9 ± 25.26 |
22.3 ± 16.24 |
20.4 ± 13.34 a |
-36.1 |
Alcohol use disorders (Al Dis) |
860 |
M |
7.3 ± 7.55 |
6.4 ± 6.23 |
5.4 ± 4.89 a |
-26.0 |
Drug use disorders (Dr Dis) |
870 |
M |
3.6 ± 3.17 |
3.7 ± 3.37 |
3.5 ± 3.28 |
-2.8 |
Digestive diseases (Dig Dis) |
1210 |
M |
43.6 ± 24.73 |
38.6 ± 23.70 |
34.1 ± 19.80 a |
-26.3 |
Peptic ulcer (P ulc) |
1220 |
M |
4.2 ± 2.80 |
2.8 ± 2.19 |
2.5 ± 2.26 a |
-40.5 |
Cirrhosis (Cirr) |
1230 |
M |
22.1 ± 18.31 |
21.0 ± 18.15 |
17.8 ± 14.52 a |
-19.5 |
|
|
|
|
|
|
|
Total ASDRs in the 49 SC |
|
M |
847.0 ± 245.9 |
703.3 ± 248.66 |
633.9 ± 219.14 a |
-25.1 |
Table 2. ASDRs of diseases considered in the analysis for the years between 2000 and 2016: mean values ± SD and % average decrease
GHE = Global health Estimation code
a = Mann-Whitney U test: 2016 Vs 2000 p <0.05
Gender |
N Males (x 103)
|
PCa ASDRs Males
|
||||
Year |
2000 |
2016 |
% incr |
2000 |
2016 |
% incr |
Country |
||||||
Armenia |
1440.92 |
1375.25 |
-4.6 |
8.93 |
14.80 |
+65.7 |
Australia |
9511.52 |
12020.35 |
26.4 |
23.35 |
15.24 |
-34.7 |
Austria |
3916.40 |
4268.48 |
9.0 |
22.99 |
13.94 |
-39.4 |
Bahamas |
145.10 |
191.54 |
32.0 |
59.31 |
54.01 |
-8.9 |
Belgium |
50348.20 |
5590.81 |
11.1 |
22.06 |
15.67 |
-39.4 |
Brazil |
86623.32 |
10283.10 |
17.8 |
27.30 |
20.51 |
-24.9 |
Brunei |
168.75 |
217.90 |
29.1 |
13.52 |
16.40 |
+21.3 |
Canada |
15225.06 |
18002.96 |
18.2 |
21.04 |
12.30 |
-41.5 |
Chile |
7546.04 |
8870.61 |
17.6 |
25.48 |
24.24 |
-4.9 |
Croatia |
2131.75 |
2030.46 |
-4.8 |
18.33 |
20.02 |
+9.2 |
Cuba |
5594.31 |
5741.37 |
2.6 |
33.52 |
30.27 |
+3.2 |
Czechia |
5005.61 |
5214.70 |
4.2 |
23.04 |
16.48 |
-28.5 |
Denmark |
2642.89 |
2840.81 |
7.5 |
29.54 |
23.13 |
-21.7 |
Estonia |
652.56 |
614.40 |
-5.8 |
26.40 |
28.44 |
+7.7 |
Finland |
2352.58 |
2710.01 |
7.0 |
23.04 |
15.95 |
-30.8 |
France |
29223.78 |
31811.65 |
8.9 |
23.46 |
13.21 |
-43.7 |
Germany |
39680.44 |
40313.09 |
8.7 |
21.30 |
15.38 |
-27.7 |
Grenada |
50.24 |
81.59 |
62.4 |
85.24 |
70.21 |
-17.6 |
Guatemala |
5716.73 |
8159.45 |
42.7 |
19.26 |
16.32 |
-15.3 |
Hungary |
4862.65 |
4637.69 |
-4.6 |
22.62 |
17.16 |
-24.1 |
Iceland |
140.34 |
166.78 |
18.8 |
25.79 |
21.06 |
-18.3 |
Ireland |
1914.25 |
2353.74 |
22.9 |
23.20 |
16.21 |
-30,1 |
Israel |
2965.57 |
4065.87 |
37.1 |
13.97 |
9.23 |
-34.1 |
Italy |
27979.90 |
28943.65 |
4.1 |
14.35 |
9.90 |
-31.0 |
Japan |
62929.57 |
62400.68 |
-0.8 |
7.55 |
6.52 |
-13.7 |
Kyrgyzstan |
2432.99 |
2953.38 |
21.4 |
6.29 |
5.62 |
-10.7 |
Latvia |
1095.57 |
904.74 |
-17.4 |
19.54 |
26.88 |
+37.6 |
Lithuania |
1638.98 |
1339.62 |
-18.3 |
23.63 |
25.85 |
+9.41 |
Luxembourg |
214.79 |
298.22 |
34.7 |
22.54 |
11.73 |
-48.0 |
Malta |
197.66 |
215.54 |
9.0 |
17.04 |
10.79 |
-36.7 |
Mauritius |
587.69 |
624.07 |
6.1 |
9.14 |
9.98 |
+9.1 |
Mexico |
50506.62 |
63501.51 |
25.7 |
15.86 |
13.97 |
-11.9 |
Netherlands |
7888.74 |
8448.04 |
7.1 |
26.79 |
17.94 |
-33.0 |
New Zealand |
1893.98 |
2291.89 |
21.9 |
26.73 |
16.44 |
-38.5 |
Norway |
2229.01 |
2648.48 |
18.8 |
32.63 |
22.76 |
-30.3 |
Rep. of Korea |
23775.81 |
25419.45 |
6.9 |
5.59 |
6.44 |
+15.2 |
Moldova |
2010.77 |
1949.21 |
-3.1 |
5.77 |
13.83 |
+132.1 |
Romania |
10825.16 |
9583.68 |
-12.5 |
11.70 |
14.13 |
+20.8 |
Saint Vincent & Grenadines |
54.33 |
55.31 |
1.8 |
80.01 |
84.63 |
+5.8 |
Slovakia |
2621.67 |
2646.52 |
0.9 |
21.73 |
22.72 |
+4.6 |
Slovenia |
970.77 |
1031.28 |
6.2 |
24.97 |
21.00 |
-15.9 |
Spain |
20077.28 |
22729.18 |
12.1 |
18.04 |
11.42 |
-36.7 |
Sweden |
4392.26 |
4920.08 |
12.0 |
30.68 |
21.64 |
-29.5 |
Switzerland |
3501.52 |
4160.14 |
18.3 |
26.06 |
16.31 |
-37.4 |
Macedonia |
1019.34 |
1040.49 |
2.1 |
11.48 |
14.68 |
+27.8 |
Trinidad and Tobago |
630.61 |
672.98 |
6.7 |
55.90 |
57.89 |
+3.6 |
United Kingdom |
28772.32 |
32443.20 |
13.0 |
22.68 |
17.53 |
-22.7 |
United States of America |
138883.47 |
159423.60 |
14.8 |
18.82 |
12.84 |
-31.8 |
Uzbekistan |
12356.1 |
15672.43 |
35.0 |
1.81 |
1.96 |
+8.4 |
|
|
|
|
|
|
|
Total |
606482.26 |
669670.90 |
|
|
|
|
Mean |
|
|
9.6à |
23.803 |
20.256 |
-10.9a |
SD |
|
|
25.33 |
16.3039 |
15.5519 |
31.91 |
Table3. Males Population (N) in the years 2000 and 2016 and relative death for PCa reported as Age Standardized Death Rates x 100000 population (ADRs). Data of the 49 SC "with high completeness and quality of cause-of-death assignment" according to the WHO [17]; % modification 2106/2000ofthe mean values
a = Mann-Whitney U test; 2016 Vs 2000 p <0.05
Cluster |
Number of members |
Disease |
1 |
8 |
Sexually transmitted diseases (STDs) Syfilis Intestinal Diseases (Int Dis) Parasitic and vectorial diseases (PVD) Diarrhea STDs females HIV(AIDS (HIV) Iron deficiency anemia (IDA) |
2 |
5 |
Digestive Diseases (Dig Dis) Cirrhosis Peptic ulcer Alcohol-related disorders (Al Dis) Tuberculosis (TBC) |
3 |
2 |
Respiratory infections (R inf) Chlamydia in females (Chlamy) |
4 |
2 |
Drug use disorders (Dr. D) Gonorrhea (Gono) |
Table 4. Cluster summary of the variables recorded in 2000 in relation to PCa in 2016.
Cluster |
Disease |
R square value within own cluster |
R square value with the closest cluster |
1 |
HIV |
0.710 |
0.181 |
1 |
IDA |
0.650 |
0.298 |
2 |
Dig Dis |
0.948 |
0.405 |
3 |
R inf |
0.808 |
0.185 |
3 |
Chlamy |
0.809 |
0.476 |
4 |
Dr Dis |
0.651 |
0.169 |
Table 5. R squared values of the selected variables Vs PCa and R square values with the closest cluster
Dig Dis = Digestive diseases; R inf = respiratory infections; Chlamy = Chlamydia in females; Dr Dis = Drug use disorders.
Disease |
Prob> F |
IDA |
3.30e-7 |
HIV |
0.00020 |
Chlamy |
0.00045 |
Dig Dis |
0.03186 |
R inf |
0.06245 |
Dr dis |
0.75036 |
Table 6. Step Wise Regression: the probability of correlation with PCA
Dig Dis = Digestive diseases; R inf = respiratory infections; Chlamy = Chlamydia in females; Dr Dis = Drug use disorders; Prob =probability.