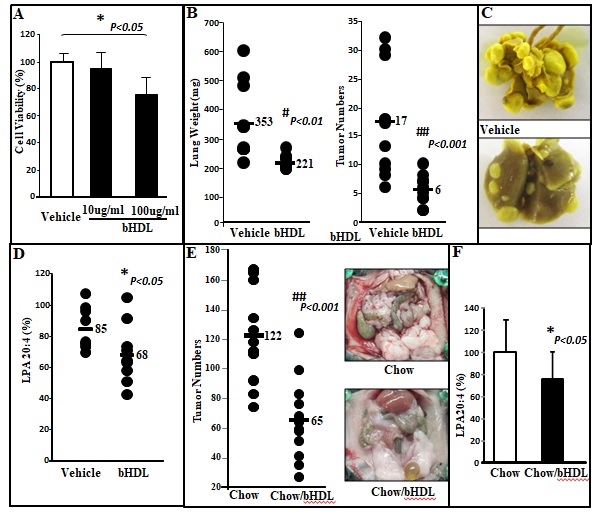
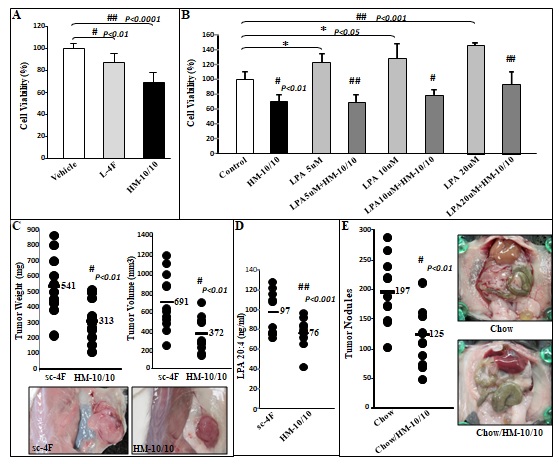
Figure 1 CT26 cell-mediated lung tumors in BALB/c mice and ID8 cell-mediated ovarian cancer burden in C57BL/6J mice are significantly decreased in mice administered bHDL. (A) CT26 cells were cultured as described in Materials and Methods and incubated with either vehicle (control) or bHDL at a concentration of 10ug/ml or 100ug.ml. CT26 cells were assayed for viability using MTS assay. Data are represented as the mean ± SD of the percent of control cells. All experiments were conducted in triplicate and each assay was carried out in quadruplicates. (B-D) Lung tumors were established in BALB/c mice (n=11 per group, 6 weeks of age) as described in Materials and Methods. Mice were sacrificed 3 weeks after CT26 cells were administered by tail vein injection. Lungs were harvested and weighed. Lung tumors were counted. (B) Left panel: lung weights of mice that were administered vehicle alone or bHDL (10mg/kg/day) subcutaneously (p< 0.01); Right panel: the number of tumors counted on the lung surface from the 2 groups of mice (p< 0.001). (C) Representative tumors from the two groups of mice showing tumor nodules on their lung surface. (D) Plasma LPA 20:4 levels were measured from (B) as described under Materials and Methods. (E-F) Wild-type C57BL/6J mice (n = 11 per group, 8 weeks of age) were injected with ID8 cells by intraperitoneal injection (8 × 10⁶ cells per mouse) and tumor burden was analyzed after 10 weeks treated with a regular chow or a chow with bHDL. (E) Left panel: The total number of tumors nodules for each mouse was counted in each group; Right panel: representative images of mice from the two groups showing the tumor nodules on the peritoneal membranes. (F) Plasma LPA 20:4 levels in the two groups of mice from (E).
Figure 2 AEM-28 reduces the cell viability of CT26 cells and CT26 cell-mediated flank tumor growth in BALB/c mice. CT26 and NIH3T3 cells were cultured as described in Materials and Methods and incubated with either vehicle or 10μg/ml of either L-4F or AEM-28. (A) CT26 cell viability as measured by MTS assay is reduced in cells treated with L-4F and AEM-28. (B) AEM-28 and L-4F have no effect on cell viability of NIH 3T3 cells. All experiments were conducted in triplicate and each assay was carried out in quadruplicates. (C-E) Flank tumors were established in BALB/c mice as described in Materials and Methods. Mice were sacrificed 15 days after CT26 cell injections and with or without treatment of AEM-28 subcutaneously. Tumors were harvested, measured and weighed. (C) Left panel: tumor weights in mice receiving vehicle (n=11) or AEM-28(n=9); Right panel: tumor volumes from the 2 groups of mice. (D) Representative photographs of flank tumors from the 2 groups. (E) Plasma LPA 20:4 levels were measured from the experiment (C) as described under Materials and Methods. (G) Plasma IL-6 levels were measured before and after treatment as described under Materials and Methods.
Figure 3 AEM-28 and AEM-28-2 reduce viability in human and mouse colonic and ovarian cancer cells but NIH3T3 and normal human colonic cells and induce apoptosis in CT26 cells in vitro. (A) All cells were cultured as described in Materials and Methods, and treated with either vehicle or AEM-28 or AEM-28-2 at a concentration of 10μg/ml. Cells were assayed for viability using the MTS assay. All experiments were performed in triplicate and each assay was carried out in quadruplicates. (B) The percentage of apoptotic cells of CT26 significantly increased with the peptide treatments when compared with control. The asterisk indicates p< 0.016 with the Beonferroni correction.
Figure 4 AEM-28 or AEM-28-2 significantly reduced CT26 cell–mediated flank tumors and lung tumors in BALB/c mice. (A-B) Flank tumors were established in BALB/c mice as described in Materials and Methods. Mice were sacrificed after 3 weeks with the treatment of vehicle or AEM-28 or AEM-28-2 administered by tail vein at 10mg/kg/week. Tumor weight and volume were measured. (A) Left panel: the data shown are tumor weights for mice receiving vehicle or AEM-28 or AEM-28-2 at 10mg/kg/week; Right panel: the data shown are tumor volumes. (B) Representative tumors are shown from three groups of mice. (C-D) Lung tumors were established in BALB/c mice as described in Materials and Methods. Mice were sacrificed 3 weeks after CT26 cells administered by tail vein injection. Lungs were harvested and weighed. Lung tumors were counted. (C) Left panel: the data shown are lung weights for mice receiving chow or AEM-28 or AEM-28-2 administered in a chow at 100mg/kg/day; Right panel: the data shown are the number of tumors counted on lung surface from the three groups of mice. (D) Representative tumors from the three groups of mice showing tumor nodules on the lung surface. Asterisk indicates p<0.016 with the Beonferroni correction.
Figure 5Flow cytometry analyses and macrophages expression of F4/80 and Ly6G in lung tumor tissue and jejunum tissue. (A) F4/80 and/or Ly6G are significantly reduced in mice after treatment with AEM-28-2 administered in a chow from FACS analyses. Cells were harvested from lamina propria described in Materials and Methods. The data have shown F4/80 and Ly6G in the percentage from lamina propria in Figure 5A. F4/80 and Ly6G immunostaining were performed on lung tumor tissue sections from the mice treated with different diets as described in Materials and Methods. (B) The quantification of F4/80 and Ly6G expression in tumor tissue on the lung surface. The brown stain represents F4/80 or Ly6G staining. F4/80 and Ly6G immunostaining were performed on jejunum tissue sections from the mice treated with a different diet. (C) The quantification of F4/80 and Ly6G expression in jejunum tissue. The brown stain represents F4/80 or Ly6G staining.
Figure 6HM-10/10 alters CT26 cell viability and inhibits LPA induced proliferation of CT26 cells; CT26 cell-mediated flank tumors are significantly decreased in BALB/c mice treated with HM-10/10 by subcutaneously and ID8 cell-mediated ovarian cancer burden is significantly decreased in C57BL/6J mice receiving HM-10/10 in chow. (A) CT26 cells were cultured as described in Materials and Methods and incubated with either vehicle or L-4F or HM-10/10 at the concentration of 10μg/ml. CT26 cells were assayed for viability using MTS assay. (B) CT26 cells were cultured and incubated with either HM-10/10 (10μg/mL) or LPA at a concentration 5, 10, or 20 μM, or cells treated with both HM-10/10 and LPA for 48 hours. Data are represented as the mean ± SD of the percent of control cells. All experiments were conducted in triplicate and each assay was carried out in quadruplicates. (C-D) Flank tumors were established in BALB/c mice (n=12 per group). Six-week-old BALB/c female mice were given a 100μL subcutaneous injection of 1×10⁶ CT26 cells prepared as a single cell suspension in PBS, and the mice were treated with sc-4F or HM-10/10 at 10mg/kg administered subcutaneously daily for 15 days. The mice were sacrificed, and tumor volumes were measured by the Vevo® 2100 system from VisualSonics. (C) Left panel: the data shown are tumor weights for mice receiving sc-4F or HM-10/10 at 10mg/kg subcutaneously daily, P< 0.01; Right panel: the data shown are tumor volumes from the two groups of mice, P< 0.01. Bottom panel: representative photographs of flank tumors from the two groups are shown. (D) Plasma LPA 20:4 levels from the experiment of (C). (E) Wild-type C57BL/6J mice (n = 11 per group, 9 weeks of age) were injected with ID8 cells by intraperitoneal injection (8 × 10⁶ cells per mouse) and tumor burden was analyzed after 10 weeks. Left panel: The total number of tumors nodules for each mouse was counted in each group; Right panel: representative images of mice from the two groups showing the tumor nodules on the peritoneal membranes.