Figure 1 (A) Example treatment planning where MRI abnormality appears larger than that outlined by DSA (green outline) by an interventional radiologist. The finalized SRS treatment volume (Target, red outline) was generated by a Neurosurgeon. (B) Study Scheme.
Figure 2 (A) Example treatment planning images of an AVM nidus volume generated by MRI (blue outline), AVM nidus generated by DSA alone by an Interventional Radiologist (green line) and the finalized target volume used for SRS treatment (red line) generated by a Neurosurgeon or Neurovascular surgeon. Hematoma is not included in the AVM nidus identified by both MRI and Cerebral angiography methods. (B) Example treatment planning images where MRI did not have a corresponding vessel or parenchyma within the superimposed Cerebral angiography identified area. (C) Example treatment planning images where the Neuroradiologist identified an AVM at a different location from the AVM that was identified by Angiogram and treated with SRS.
Figure 3 (A) Example treatment planning where the AVM nidus volume generated by MRI alone by a neuroradiologist (MRI, blue outline) was larger than that generated by DSA alone by an interventional radiologist superimposed on MRI (green outline). The finalized SRS treatment volume (Target, red outline) generated by a Neurosurgeon. (B) Example treatment planning images where the DSA volume was larger than that generated from MRI alone. (C) Volume scatter plot showing the distribution of finalized SRS treatment volume (Target), AVM nidus identified by MRI alone (MRI) and digital subtraction angiography (DSA).
Figure 4 Bland-Altman plots of the contoured AVM volumes that assess the agreement between the two measures on an individual level. The 95% limits of agreement (LOA) is depicted by the dotted line that represents the 1.96 standard deviation from the mean of the measurements by two methods. Finalized SRS treatment volume (Target), AVM nidus identified by MRI alone (MRI) and AVM nidus identified by digitally subtraction angiography (DSA).
Figure 5 Figure 5: (A) Graphic representation of two overlapping volumes A and B. (B) Mathematical equation and graphic representation of the Dice Similarity Coefficient (DSC) and Jaccard Index (JI). (C) Scatter plot of DSC of finalized treatment volume (Target) and AVM nidus identified by MRI alone (MRI), noted as B=MRI, compared to target and AVM nidus identified by digital subtraction angiography (DSA), noted as B=DSA. (D) Scatter plot of JI of Target and MRI, noted as B=MRI, compared to Target and DSA noted as B=DSA.
One-way analysis of variance |
|||
P value |
0.662 |
||
P value summary |
ns |
||
Are means significantly different? (P < 0.05) |
No |
||
Number of groups |
3 |
||
F |
0.4132 |
||
R squared |
0.003432 |
||
Bartlett's test for equal variances |
|||
Bartlett's statistic (corrected) |
2.151 |
||
P value |
0.3411 |
||
P value summary |
ns |
||
Do the variances differ signif. (P < 0.05) |
No |
||
ANOVA Table |
SS |
df |
MS |
Treatment (between columns) |
10.78 |
2 |
5.388 |
Residual (within columns) |
3129 |
240 |
13.04 |
Total |
3140 |
242 |
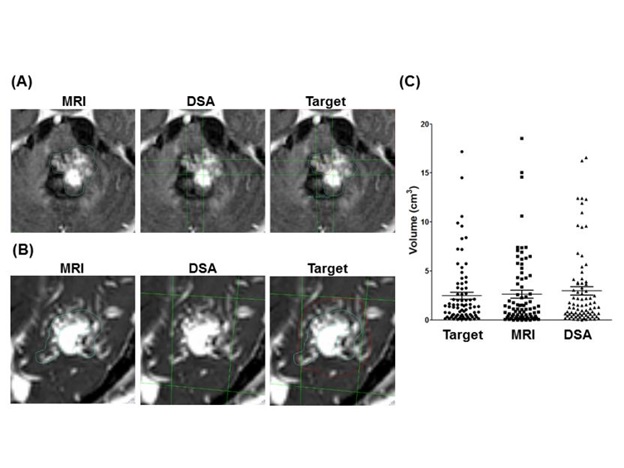
Table 1:One-way ANOVA comparison of the target, MRI-generated and DSA-generated volumes
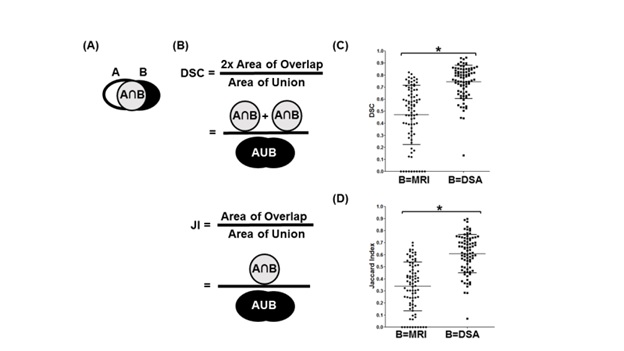
Table Analyzed: DSC |
Target:MRI |
Target:DSA |
Number of values |
81 |
81 |
Minimum |
0 |
0.1327 |
25% Percentile |
0.3129 |
0.6613 |
Median |
0.5297 |
0.7763 |
75% Percentile |
0.6778 |
0.8467 |
Maximum |
0.824 |
0.9456 |
Mean |
0.4702 |
0.7437 |
Std. Deviation |
0.2465 |
0.1377 |
Std. Error |
0.02739 |
0.0153 |
Lower 95% CI |
0.4157 |
0.7133 |
Upper 95% CI |
0.5247 |
0.7742 |
Paired t test |
||
P value |
< 0.0001 |
|
Are means signif. different? (P < 0.05) |
Yes |
|
One- or two-tailed P value? |
Two-tailed |
|
t, df |
t=8.260 df=80 |
|
Number of pairs |
81 |
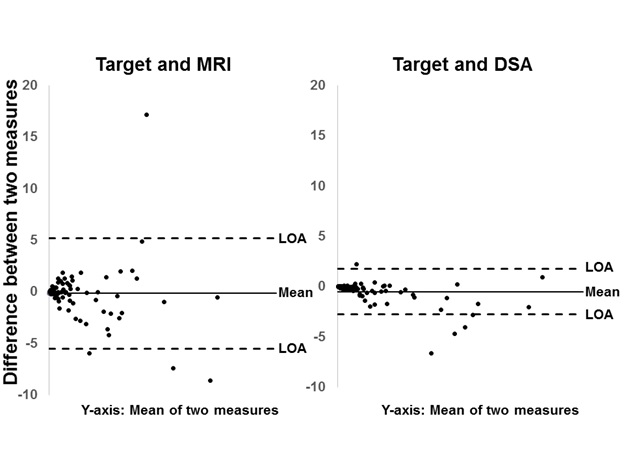
Table 2:Matched pair analysis of Dice Similarity Coefficients(DSC) between the finalized target and DSA-generated volume compared to DSC between the finalized target and the MRI-generated volume.
Table Analyzed: Jaccard Index |
Target:MRI |
Target:DSA |
Number of values |
81 |
81 |
Minimum |
0 |
0.07106 |
25% Percentile |
0.1854 |
0.494 |
Median |
0.3603 |
0.6344 |
75% Percentile |
0.5127 |
0.7342 |
Maximum |
0.7007 |
0.8969 |
Mean |
0.3391 |
0.609 |
Std. Deviation |
0.202 |
0.159 |
Std. Error |
0.02245 |
0.01766 |
Lower 95% CI |
0.2945 |
0.5738 |
Upper 95% CI |
0.3838 |
0.6441 |
Paired t test |
|
|
P value |
< 0.0001 |
|
Are means signif. different? (P < 0.05) |
Yes |
|
One- or two-tailed P value? |
Two-tailed |
|
t, df |
t=9.519 df=80 |
|
Number of pairs |
81 |
|
Table 3:Matched pair analysis of Jaccard Index between the finalized target and DSA-generated volume compared to DSC between the finalized target and the MRI-generated volume.