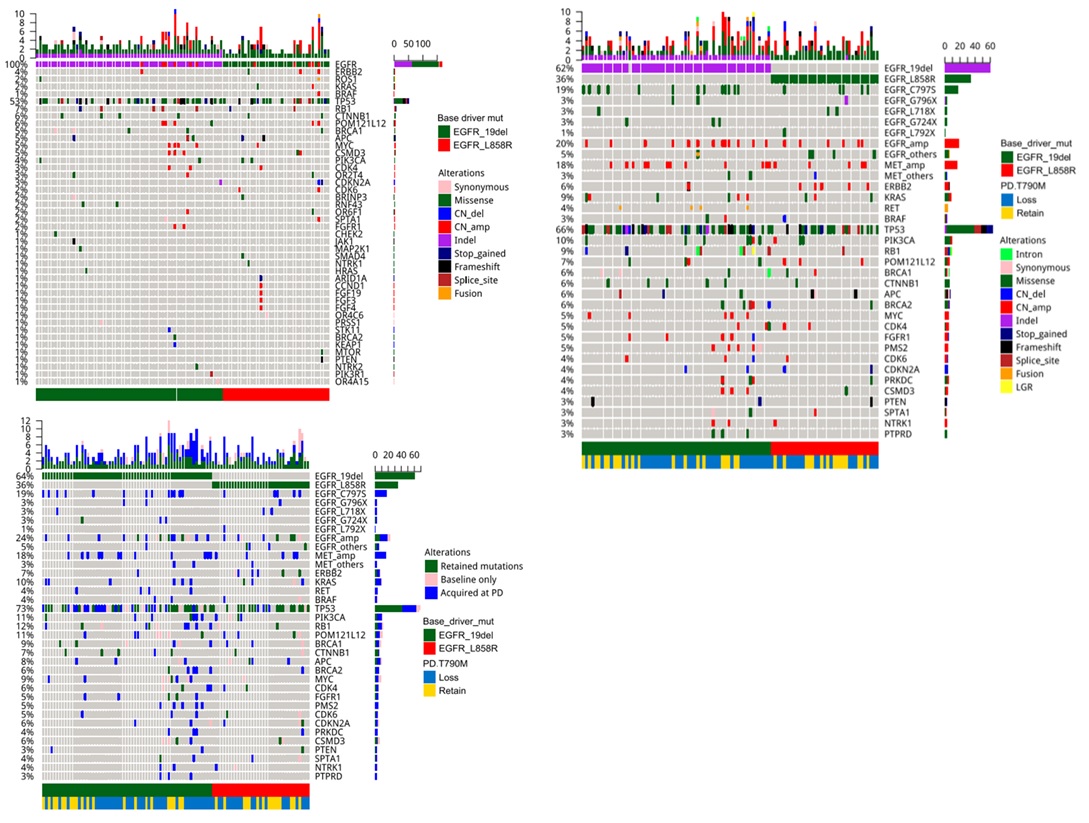
Figure 1:Mutation profile of the cohort prior to osimertinib therapy (A), and at disease progression with osimertinib (B). The mutation profiles from the two time-points were also compared and depicted in (C). A-C. The patients were grouped according to baseline EGFR mutations 19del (green) or L858R (red) as indicated by the bar located at the bottom of the oncoprint. B�C. An annotation depicting the EGFR T790M status of each patient at progression, whether lost (blue) or retained (yellow) was also added at the bottom of the oncoprint. Each column represents a patient and each row represents a gene. Table on the left represents the mutation rate of each gene. Top plot represents the overall number of mutations a patient carried. Different colors denote different types of mutation.
Tables at a glance
Figures at a glance