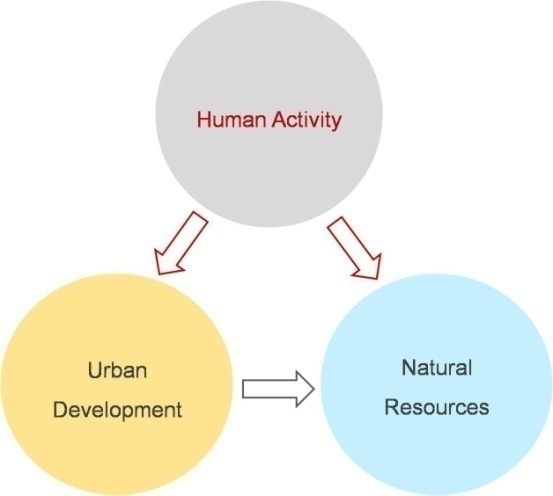
Figure 1: Consequences of human activity on urban development and natural resources
Figure 1: Consequences of human activity on urban development and natural resources
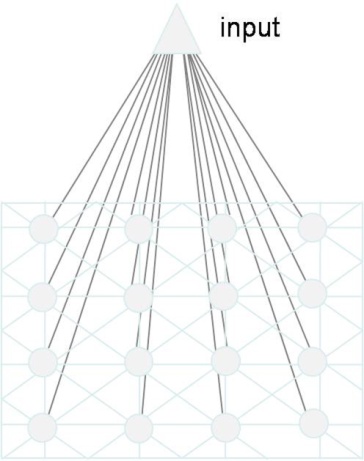
Figure 2: SOM [33] prototype with sixteen model neurons in a fully connected functional architecture
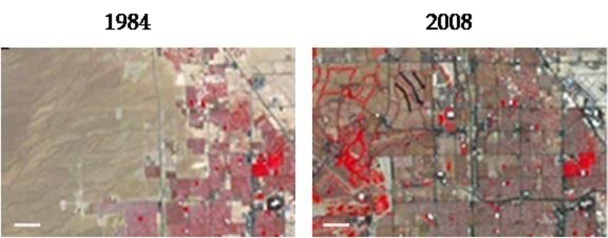
Figure 3: Satellite image examples showing the residential North of Las Vegas in 1984 and 2008
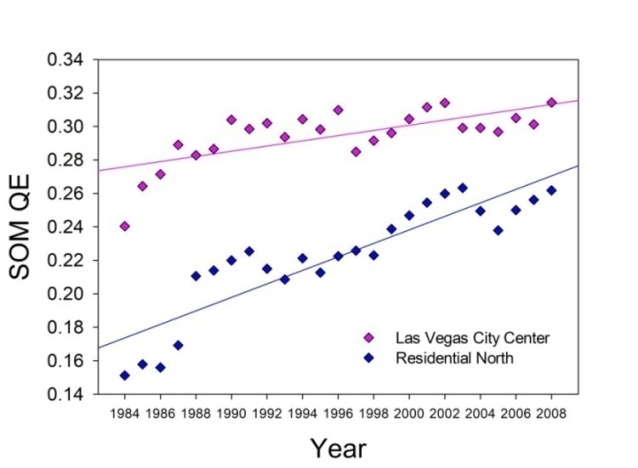
Figure 4: Linear fits to SOM-QE trends as a function of the image year and ROI
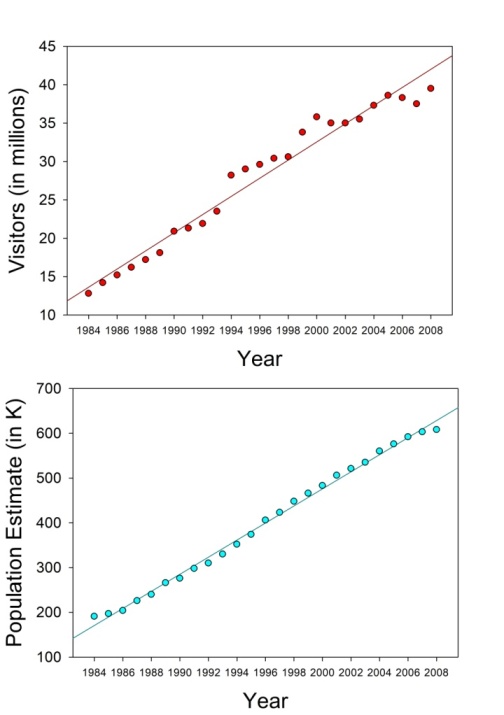
Figure 5: Linear fits to visitor (top) and population (bottom) statistics for Greater Las Vegas
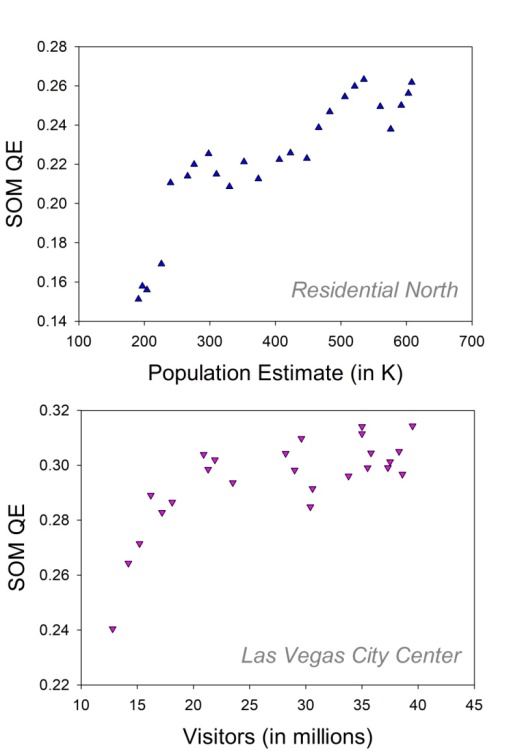
Figure 6: Correlations between SOM-QE and population (top) and visitor (bottom) statistics
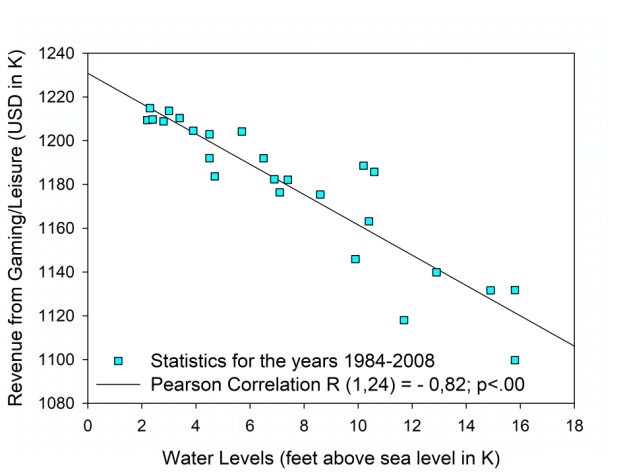
Figure 7: Economic growth vs water availability (University of Nevadaʹs Center for Gaming Research Annual Statistics and US Department of Interiorʹs Bureau of Reclamation Hoover Dam Control Room statistics for the years 1984-2008)
Tables at a glance
Figures at a glance