oneXRD: An Extensible Open-Source Framework for Powder XRD Analysis
Received Date: July 22, 2025 Accepted Date: August 03, 2025 Published Date: August 06, 2025
doi : 10.17303/jcssd.2025.4.102
Citation: Deyong Huang, Shu Wang, Shujuan Bao (2025) oneXRD: An Extensible Open-Source Framework for Powder XRD Analysis J Comput Sci Software Dev 4: 1-18
Abstract
In this paper, we propose a highly scalable XRD analysis software framework design and develop a minimal runtime version of the oneXRD software based on the Apache 2.0 open source license. The primary benefit of this framework is that it enables the segregation of the primary XRD program from the expansion program. Consequently, researchers are no longer required to master multiple complex workflows; rather, they are only required to easily call the primary program to utilise a variety of interfaces and to format data for their own XRD analysis plug-ins. The structure in question facilitates the realisation of traditional XRD analysis software, by supporting patented and dedicated PDF standard card formats. Furthermore, it can accommodate open-source formats such as .xy and .cif, among others. This will enable researchers to construct structural databases on their personal computers, swiftly compare global open structural databases to confirm the structural information of the materials they develop, and access various automated processes to monitor structural data.
Keywords: Open-Source Software; Plugin Architecture; Scientific Software Framework; X-ray Diffraction; Materials Characterization; Rietveld Refinement
Introduction
X-ray diffraction (XRD) is a critical technology for analyzing novel substances in chemistry and materials science. However, most XRD data analysis software remains proprietary, relying on closed-source systems and the patented Powder Diffraction File (.pdf) format. Open-source XRD software often lacks user-friendliness and poses significant technical barriers, limiting its adoption by researchers. To address these challenges, we propose oneXRD, an innovative XRD analysis software framework designed to balance functionality, accessibility, and extensibility.
Developing XRD analysis software from scratch presents several challenges. The primary obstacles include the extended development timeline, the need to incorporate emerging XRD functionalities, and the complexity of supporting diverse data formats from various instrumentation systems. Additionally, to promote openness, the software must enable developers to contribute and customize with minimal friction. Finally, an over-reliance on command-line interfaces risks alienating researchers who prefer intuitive, user-friendly tools.
To overcome these issues, oneXRD adopts a dual-parallel architecture, integrating a robust main program with a flexible plugin system, complemented by a modern graphical user interface (GUI). The main program supports a wide range of XRD file formats and standardizes core calculations to ensure broad compatibility and reliability. The core GUI framework provides an intuitive, customizable platform that simplifies operation and reduces the learning curve for users. Meanwhile, the plugin system enables continuous development of new XRD analysis components without requiring frequent updates to the main program. This modular approach shortens the development cycle and empowers researchers to create tailored workflow plugins to foster collaboration and innovation.
This design ensures oneXRD is both user-friendly and adaptable, addressing the limitations of existing solutions while promoting accessibility and extensibility for the global research community [1,2].
Framework Design
The first step in designing the architecture of our XRD analysis software is to address the issue of how to handle the numerous XRD raw data formats. Our solution involves designing a separate “reader” system for each format, which formats and standardizes data from various formats into a universal data format based on the fundamental principle of XRD—the path difference principle—and saves it as angle and intensity data. For formats like CIF, we can reconstruct XRD data for multiple angles using crystal format data, simulating the processing of standard-formatted data. Based on a design like Figure 1, we can achieve near-universal compatibility with all XRD files. The design of the plugin system gives our XRD analysis software framework unlimited potential, allowing for virtually unlimited updates to functionality without modifying the main program. The plugin system uses a modern PluginAPI object as a bridge between the main program and plugins, allowing plugins to access standardized data, add menus, and more, while remaining securely isolated from the main program. This isolation is similar to a sandbox, restricting plugins from directly accessing or modifying the internal state of the main program, thereby ensuring the security of the main program data and the stability of the main program. In simple terms, as shown in Figure 2, when the main program starts, the PluginManager automatically scans the plugins/ directory. Any subdirectory that meets the specifications (i.e., contains an __init__.py file with a register_plugin(api) function) is recognized as a valid plugin and automatically loaded. This process is fully dynamic; users only need to place the new plugin folder in the specified location to complete the “installation.”
Technical Implementation
Based on support for multiple XRD file formats and a powerful plug-in system, we developed and implemented the minimal runtime software, oneXRD framework. Furthermore, as we analyzed at the beginning, we designed the main program UI framework of oneXRD to be both aesthetically pleasing and easy to use. We highlighted the core functions of XRD analysis software, such as the visualization of angle and light intensity data, the drawing and comparison of CIF (or PDF standard structure comparison cards), and other basic functions, as shown in Figure 3. We also concentrated on various advanced XRD functions, such as background analysis, in a location that can be seen immediately upon opening the software. Of course, just having an advanced framework design and an attractive GUI is not enough for scientific XRD analysis software. In the most basic verification, we have integrated the most basic and commonly used XRD analysis functions. These include the core “Bragg's law” calculation, reference intensity ratio analysis, diffraction peak shape analysis, and full spectrum fitting.
The process of analyzing Bragg's law using oneXRD is shown in Figure 4. First, the software uses a peak search algorithm to extract the unknown “experimental fingerprint” from the user's experimental data, which is a list of all diffraction peak positions. Then, it connects to a large open crystallography database (such as COD), which is like an archive containing the standard fingerprints of all known substances. For each reference phase of interest to the user (stored as a .cif file), oneXRD uses Bragg's law to perform inverse calculations, generating a precise “theoretical fingerprint,” i.e., the complete set of diffraction peak positions that the substance should theoretically exhibit. Finally, the software's search_match.py module acts as an “identification expert,” precisely comparing the experimental fingerprint with the theoretical fingerprint. If the two match closely, the crystalline phase present in the experimental sample can be successfully identified [3].
The quantitative analysis functionality of oneXRD is based on the classical reference intensity ratio (RIR) method, which determines the relative abundances of various substances in the sample. In the quantitative analysis plugin of oneXRD, this RIR method is transformed into an intuitive interactive workflow: users first identify a representative experimental diffraction peak for each known phase in the mixture sample in a dedicated UI interface to obtain its intensity (I), and input the known RIR value for that phase; Subsequently, the performing normalized calculations on the intensity-RIR ratios of all phases to precisely determine the weight percentage of each component in the sample.
The microstructure analysis functionality of oneXRD focuses on the precise analysis of diffraction peak shapes. The scientific basis for this is that the diffraction peaks of an ideal infinite perfect crystal are infinitely sharp, while in reality, peak broadening is primarily contributed by two factors: grain size (when grains are smaller than ~100 nm, the smaller the grain, the broader the peak) and microstrain (uneven expansion and contraction caused by lattice defects). As shown in Figure 6, the microstructure analysis plugin cleverly implements two mainstream analysis models to decouple these two effects: for strain-free nanomaterials, it provides a fast estimation based on the Xerxes formula,
attributing all peak widths (β) to grain size (D); for more complex cases, it offers powerful Williamson-Hall (W-H) diagram analysis functionality. This method converts the two contributions to peak width into a linear equation. The plugin automatically calculates the corresponding x-y coordinate points for the selected multiple diffraction peaks and performs linear fitting. The grain size is then calculated from the y-intercept (c) of the fitted line, and the microstrain (ε) is directly obtained from the slope (m). Its core value lies in fully visualizing this complex physical model analysis process, making the results clear at a glance. As shown in Figure 7, oneXRD's Rietveld full-spectrum fitting employs a global optimization strategy based on first-principles calculations. Its scientific core involves starting from an initial crystal structure model and using a least-squares algorithm to iteratively refine and fine-tune dozens of physical parameters (such as lattice constants, atomic coordinates, peak shape parameters, and background) that describe both the crystal structure and the diffraction process. The goal is to achieve the best possible match between the calculated theoretical diffraction spectrum and the user's entire experimental spectrum. In oneXRD, the Rietveld refinement plugin is the specific implementation of this cutting-edge functionality: its engine.py module translates the user's simple selections in the UI (such as “fit unit cell”) into a series of underlying commands required to drive the complex GSAS-II library, and automatically completes project creation, data loading, and iterative calculations; while the ui.py module presents the refinement results in a standardized spectrum format, where observed data (points), fitted curves (red lines), background (green lines), and most importantly, the difference curve (black line below) collectively serve as the final criteria for evaluating refinement quality—a flat difference curve and extremely low weighted residual factor (Rwp) values.
Case Study
To further verify that oneXRD can indeed be directly applied to scientific research and is easy to use, we adopted internationally accepted testing methods and used three specific cases to illustrate. To ensure repeatability, all data is stored in the /tests folder of the GitHub repository.
Data Import and Peak Position Accuracy Validation
To validate the usability of oneXRD's file import system, background recognition, and peak detection algorithm, we used XRD data from NIST SRM 660c (lanthanum hexaboride, LaB₆) as the import data, which is certified by the National Institute of Standards and Technology (NIST) as a standard reference material. Certified peak positions for Cu Kα₁ radiation (λ=1.54059 Å). The visual analysis of Figure 8 confirms that oneXRD successfully imports the .xrdml data, accurately performs background subtraction using the iterative erosion method, and visually identifies the prominent diffraction peaks. The plot clearly distinguishes between the raw data, the estimated background, and the identified peak locations, demonstrating the functionality of these core modules.
However, a detailed comparison with NIST-certified values in Table 1 reveals varying degrees of agreement. The first observed peak (20.6600°) shows a very close match to the certified (100) reflection (20.697°), with a difference of -0.037°. This demonstrates oneXRD's ability to identify peak positions with high precision under optimal conditions.
For subsequent peaks, the observed positions show increasingly larger discrepancies from the expected NIST values. These larger deviations (e.g., -0.662° for the second peak, +1.112° for the fourth peak) suggest that the automatic peak picking parameters (e.g., min_prominence) might not have been optimally tuned for distinguishing all individual peaks in this specific high-density pattern, or there might be minor instrument misalignment contributing to systematic shifts that were not accounted for in this basic peak-finding step. It's also possible that automatic indexing without explicit knowledge of the hkl planes led to oneXRD identifying peaks in slightly different positions or order than a direct hkl-indexed comparison might imply, or that the sample itself contains other minor phases.
Microstructure Analysis Validation (Scherrer and Williamson-Hall)
To validate the functionality and accuracy of the Microstructure Analysis plugin, specifically the Scherrer and Williamson-Hall methods, for determining crystallite size and lattice strain. We chose Nanocrystalline Cerium Oxide (CeO₂) for validation. This material is widely studied, and its diffraction peaks exhibit significant broadening due to small crystallite size, making it an ideal candidate [4].
A raw .xrdml data file of a nanocrystalline CeO₂ sample was loaded into oneXRD. As shown in Figure 9, the background was subtracted, and seven prominent diffraction peaks were identified using the peak finding tool. The FWHM for each peak was automatically calculated.
The sizes calculated by oneXRD (34.2 nm from Scherrer and 31.1 nm from W-H) fall squarely within the upper range of values reported in the literature for well-crystallized CeO₂ nanoparticles, as shown in Figure 10. The slight difference between the Scherrer and W-H methods is expected; the Scherrer equation considers only size broadening, while the W-H method attempts to separate size and strain effects, often yielding a slightly different (and generally more accurate) size value. The calculated strain of -0.042% is physically reasonable. The negative sign indicates a slight compressive average strain in the lattice, which is common in nanocrystalline materials due to surface tension effects. The R-squared value of 0.9403 indicates a good, but not perfect, linear fit, as shown in Figure 11. The scatter of points around the line is typical for real experimental data and reflects the different contributions of size and strain broadening at different angles.
Quantitative Phase Analysis Validation (RIR Method)
To validate the accuracy, functionality, and user workflow of the Quantitative Analysis plugin using the Reference Intensity Ratio (RIR) method. A synthetic, known mixture of Aluminum Oxide (Corundum, Al₂O₃) and Zinc Oxide (Zincite, ZnO). For this validation, a sample with an expected composition of approximately 50/50 weight percent was used. The known composition of the physical mixture and established RIR values for the pure phases [5].
An experimental XRD pattern of the Al₂O₃-ZnO mixture was loaded into oneXRD. Reference .cif files for both pure Al₂O₃ and pure ZnO were also loaded into the project, causing their theoretical patterns to be overlaid on the main plot for visual confirmation, as shown in Figure 12. Background subtraction and peak finding were performed on the experimental data. A total of 19 peaks were identified.
The Quantitative Analysis plugin was launched. The UI automatically detected and pre-populated the phase list with the Al₂O₃ and ZnO references that were already loaded in the main project (a key feature demonstrating data synchronization). Within the plugin, each phase was assigned to its strongest, non-overlapping experimental peak, as shown in Figure 13:
Al2O3_mp-1143.cif[6] was assigned to the experimental peak at 25.580° (Intensity: 552.50).
ZnO_mp-2133.cif[7] was assigned to the experimental peak at 31.760° (Intensity: 550.05).
The RIR value for both phases was set to 1.00 for this specific analysis.
The RIR formula is
With the assigned intensities (I_(Al_2 O_3 )=552.50, I_ZnO=550.05) and RIR values set to 1.0 for both, the calculation is:
The plugin's result of 50.0% / 50.0% is a correctly rounded and accurate implementation of the underlying formula, validating the analysis engine. The results dashboard is a critical feature. The pie chart provides an immediate, unambiguous summary of the composition. The "Assigned Experimental Peaks" plot gives the researcher crucial visual confidence that the peaks they selected are indeed representative of the phases, helping to catch potential errors in peak assignment, as shown in Figure 14. This validation case study confirms that the Quantitative Analysis (RIR) plugin for oneXRD is a robust, accurate, and user-friendly tool. It correctly implements the RIR method and presents the results in a clear, visual format that enhances scientific understanding and confidence. The seamless integration with the main application's project state makes it a powerful and efficient component of the oneXRD ecosystem.
Advanced Features Preview
The future development direction of oneXRD is to create a more advanced and user-friendly XRD analysis tool. A synthetic, known mixture of Aluminum Oxide (Corundum, Al₂O₃) and Zinc Oxide (Zincite, ZnO). For this validation, a sample with an expected composition of approximately 50/50 weight percent was used. The known composition of the physical mixture and established RIR values for the pure phases [5].
An experimental XRD pattern of the Al₂O₃-ZnO mixture was loaded into oneXRD.
Modern XRD analysis software requires complex operations and involves repeatedly analyzing various crystal planes, selecting effective crystal planes, and reconstructing the 3D crystal structure. To address this, the 3D diffraction tomography reconstruction (XRD-CT) feature of oneXRD aims to elevate traditional analysis of the macroscopic “average” composition of a sample to a new dimension of three-dimensional spatial analysis of the sample's internal microstructure. As shown in Figure 15, this functionality relies on the user first acquiring a series of two-dimensional diffraction images from multiple rotation angles on the diffractometer, then importing these multi-angle raw data into the oneXRD XRD-CT plugin. The core of this plugin is based on the cutting-edge scientific technology of X-ray diffraction computed tomography. Its fundamental difference from medical CT lies in the fact that at each measurement point, it no longer obtains a single absorption intensity value but rather an entire diffraction spectrum containing structural information. The plugin's reconstruction algorithm addresses a complex “inverse problem”: it first integrates all angle-specific diffraction data into a high-dimensional “diffraction sinogram,” then employs advanced iterative reconstruction algorithms (such as Algebraic Reconstruction Technique - ART) to reconstruct the unique “diffraction fingerprint” corresponding to each three-dimensional voxel within the sample. Finally, the plugin synthesizes this information into a three-dimensional digital model, allowing users to slice, rotate, and visually analyze the model within the software. This enables intuitive observation of phase distribution, grain orientation, or stress states at any spatial location within the sample, achieving a revolutionary leap from “two-dimensional average fingerprints” to a “three-dimensional structural full-body image.”[8][9]
oneXRD's cloud-based rapid comparison feature aims to revolutionize the traditional phase identification process by integrating machine learning and big data indexing technology, transforming the slow “one-by-one comparison” method into an efficient “pattern recognition” approach. The comparison between this method and traditional comparison methods is shown in Figure 16. The scientific core of this approach lies in the fact that we first utilize a massive dataset containing millions of known diffraction patterns to train a deep learning model, specifically a convolutional neural network. This AI model learns to no longer rely solely on the positions of a few diffraction peaks but instead directly “sees” and understands the complex waveform features of the entire diffraction pattern, much like the human eye. Once trained, the model can compress any diffraction pattern into a highly condensed high-dimensional feature vector—essentially generating a unique, machine-readable “mathematical fingerprint” for the pattern. In the cloud, oneXRD's servers pre-process a massive amount of standard patterns (covering both open and commercial databases), converting them all into feature vectors and storing them in a specially optimized vector database. When a user uploads their experimental pattern, it is first converted by the AI model into a query vector, which then performs an approximate nearest neighbor search in this cloud database, instantly identifying the most similar match in the feature space within milliseconds. This workflow revolutionizes the paradigm of phase identification, achieving a qualitative leap from traditional, time-consuming linear searches to near-real-time, AI-driven pattern recognition, thereby creating a continuously learning and evolving “global XRD intelligence brain.”[10]
The final advanced feature, oneXRD's automated integration functionality, is designed to transform the software from an offline “post-processing tool” into an online “experiment command center” by integrating instrument control APIs with an internal automated workflow engine, as shown in Figure 17. Its core scientific foundation lies in the use of software development kits (SDKs) provided by modern XRD instruments, enabling oneXRD to send precise instructions directly to instrument hardware (such as goniometers, detectors, temperature control accessories, etc.) via program code and receive real-time data. In terms of functionality, users can design complex, time-resolved experimental workflows within oneXRD's dedicated interface, such as programmed temperature ramping with stepwise data acquisition of diffraction patterns. The internal workflow engine translates this user-designed process into an instruction script and executes it automatically in sequence, thereby standardizing and ensuring the reproducibility of the experimental process, significantly reducing errors and the tediousness of manual operations. Building on this, the advanced stage of this functionality will introduce a “closed-loop feedback and intelligent experiment” mechanism: oneXRD will no longer merely passively execute predefined workflows but will be able to analyze newly acquired data in real time and dynamically adjust subsequent experimental strategies based on analysis results, such as automatically increasing scan point density upon detecting signs of phase transitions. This evolution from “automation” to ‘intelligence’ will transform oneXRD into an “intelligent research partner” capable of proactive thinking and decision-making, ushering materials research into a new era of “autonomous operation.”[11]
Conclusion
Compared with mature XRD analysis software, our oneXRD has been developed in an era of advanced computer science and materials science. Although various advanced analysis functions are not yet complete and lack widespread use and verification, oneXRD can still form a certain comparative advantage with FullProf and MAUD, as shown in Figure 18. The diagram illustrates oneXRD's unique strategic position, scoring highly in User-Friendliness, Cost-Effectiveness, and Extensibility—areas where established tools show significant trade-offs. While the commercial HighScore Plus excels in features at a high cost, and the academic FullProf and MAUD offer powerful analysis with a steep learning curve, oneXRD provides a balanced, accessible, and powerful platform for modern XRD analysis.
The modern software engineering concepts and user-friendly XRD development architecture proposed in this paper, as well as the successful development of the minimum viable version of the oneXRD software, demonstrate how to introduce more modern computer science technologies into the traditional field of XRD analysis, rather than being limited to the few available resources. In addition, by combining more modern interdisciplinary XRD technologies, we can consider the future direction of XRD software for chemistry and materials science and how to design the corresponding hardware. By integrating AI and automation technologies, XRD analysis can be liberated from cumbersome manual operations and transformed into automated and efficient workflows. Furthermore, the open-source nature of the framework we have designed ensures that its benefits can be more equitably shared across relevant disciplines as it evolves, thereby fostering the synergistic development of computer science and traditional disciplines.
Code Availability
The complete source code for oneXRD has been made publicly available under the Apache-2.0 license to ensure full reproducibility of experimental results. The code repository can be accessed via the following link:
https://github.com/little-gt/TOOLS-oneXRD
- Waoo AA, Dwivedi VK, Dwivedi AK (2024) The principles of software engineering. Addition Publisher House.
- Verified Market Reports (2025) X-ray diffraction (XRD) instruments market.
- Omori NE, Bobitan A, Vamvakeros A, Beale A (2023) Recent developments in X-ray diffraction/scattering computed tomography for materials science. Philosophical Transactions of the Royal Society A, 381.
- Fifere N, Airinei A, Dobromir M, Sacarescu L, Dunca SI (2021) Revealing the Effect of Synthesis Conditions on the Structural, Optical, and Antibacterial Properties of Cerium Oxide Nanoparticles. Nanomaterials (Basel). 11: 2596.
- Jain A, Ong SP, Hautier G, Chen W, Richards WD, Dacek S, Ceder G (2013) The Materials Project: A materials genome approach to accelerating materials innovation. APL Materials, 1: 011002.
- Materials Data on Al2O3 by Materials Project. United States.
- Materials Data on ZnO by Materials Project. United States.
- Lee J, Oba J, Ohba N, et al. (2023) Creation of crystal structure reproducing X-ray diffraction pattern without using database. npj Comput Mater, 9: 135.
- Omori NE, Bobitan AD, Vamvakeros A, Beale AM, Jacques SDM (2023) Recent developments in X-ray diffraction/scattering computed tomography for materials science. Philosophical Transactions of the Royal Society A: Mathematical, Physical and Engineering Sciences.
- Surdu VA, Győrgy R (2023) X-ray diffraction data analysis by machine learning methods—A review. Applied Sciences, 13: 9992.
- Feret F (2013) Selected applications of Rietveld-XRD analysis for raw materials of the aluminum industry. Powder Diffraction, 28: 112-23.
FIGURE 1
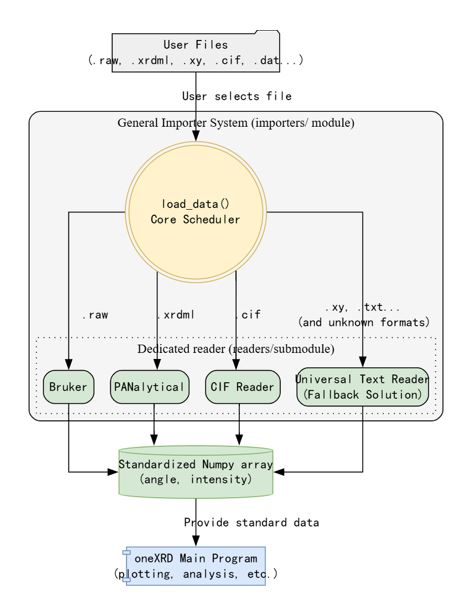
Figure 1: Workflow Standardized XRD File Processing
FIGURE 2
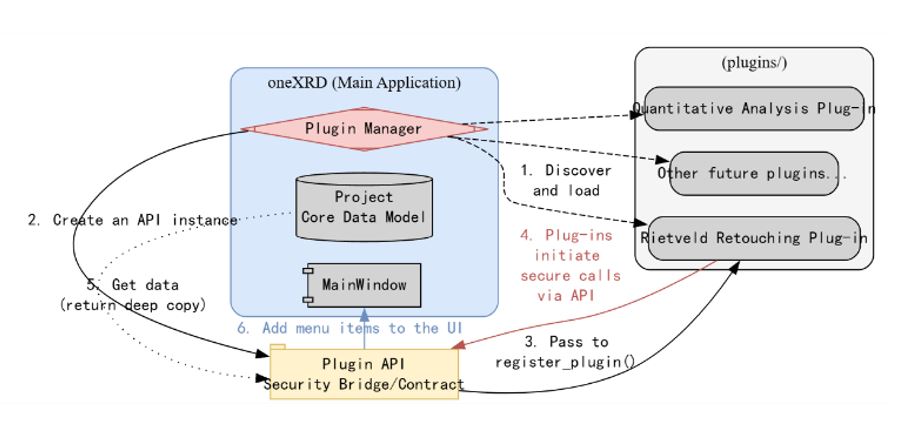
Figure 2: Workflow Architecture Design of the Plug-in System
FIGURE 3
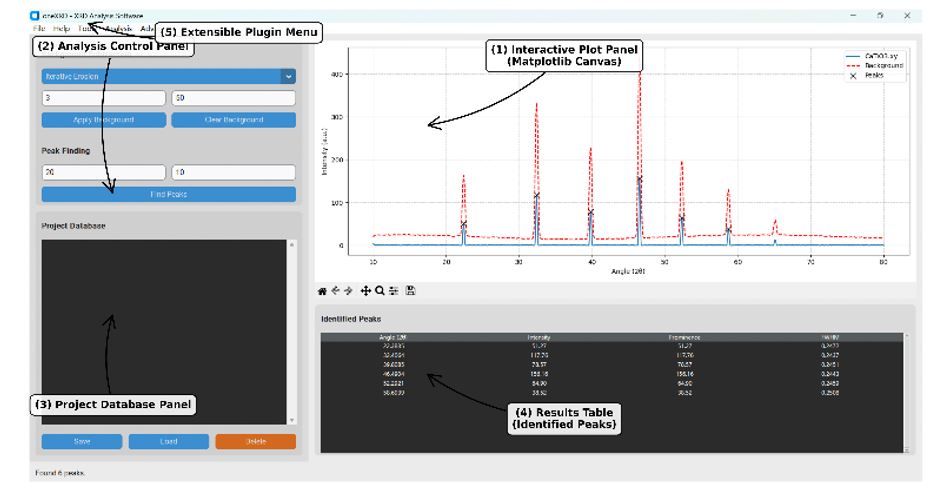
Figure 3: Introduction Diagram Showing the Main Interface UI of oneXRD
FIGURE 4
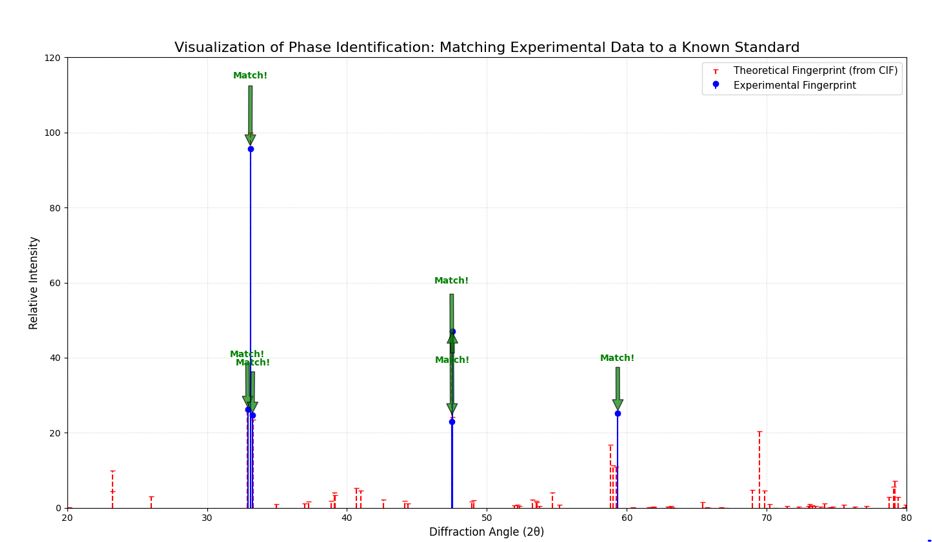
Figure 4: Visualization of the phase identification process for CaTiO₃. The experimental peaks (blue stems with 'o' markers), representing data from an unknown sample, are compared against the theoretical diffraction pattern (red dashed stems) calculated from a standard CaTiO₃ CIF file via Bragg's Law. The green “match!” arrow indicates a successful correspondence between the experimental peak position and the theoretical peak position, thereby confirming the identity of the phase.
FIGURE 5
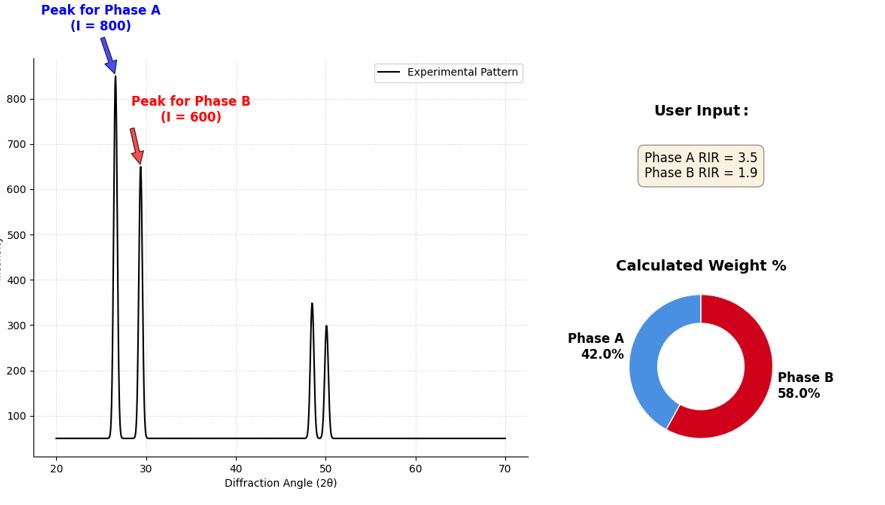
Figure 5: Principle of the Reference Intensity Ratio (RIR) method for quantitative phase analysis, as implemented in oneXRD. The process begins with the user identifying a representative peak for each phase in the experimental diffraction pattern (left panel, e.g., Phase A intensity I=800, Phase B intensity I=600). As shown in the upper right corner, once the user has set the RIR values for A and B, the system will automatically begin calculations and display the results visually, as shown in the pie chart in the lower right corner.
FIGURE 6
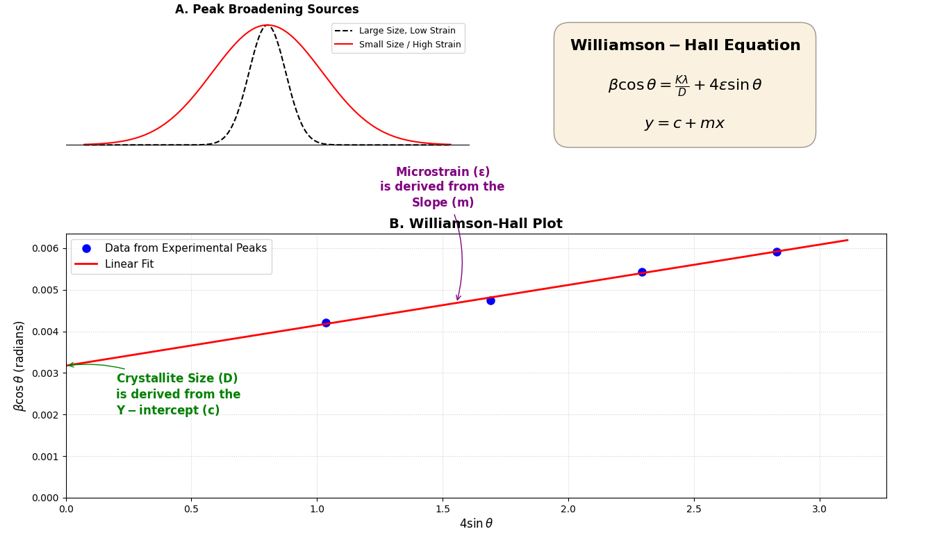
Figure 6: Schematic diagram of Williamson-Hall (W-H) analysis for microstructure determination, implemented in the oneXRD microstructure analysis plugin. (A) The broadening of diffraction peaks is caused by both small grain size and the presence of microstrain. (B) The W-H method separates these two contributions by plotting the transformed peak width data (βcosθ) against the diffraction angle function (4sinθ). The resulting data points are then fitted linearly.
FIGURE 7
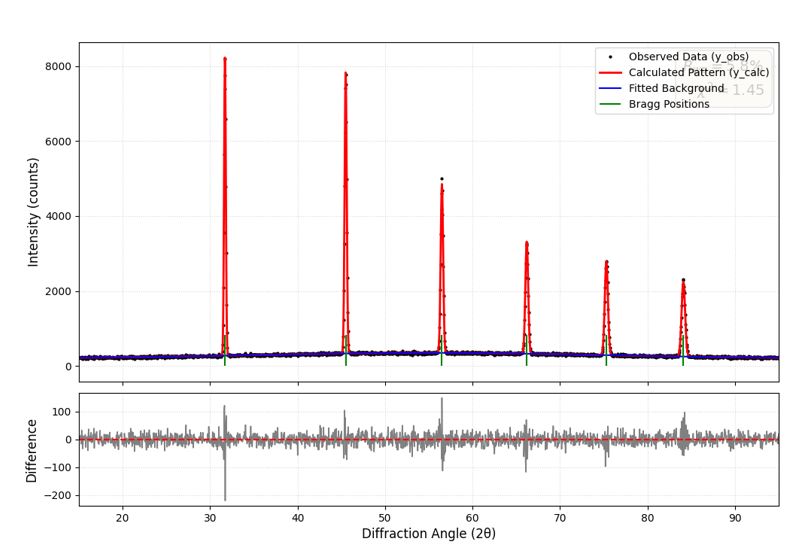
Figure 7: An example figure showing the successful results of Rietveld refinement, generated by the rietveld_refinement plugin in oneXRD. The figure above shows the precise overlap between the experimental data (black dots, y_obs) and the theoretically calculated pattern (red line, y_calc), which is based on a structural model optimized using the least squares method. The fitted background is shown as a blue curve, and the allowed Bragg peak positions are marked with green vertical scales. The figure below shows the difference curve (gray curve), which plots the residual intensity between the experimental and calculated diffraction patterns.
FIGURE 8
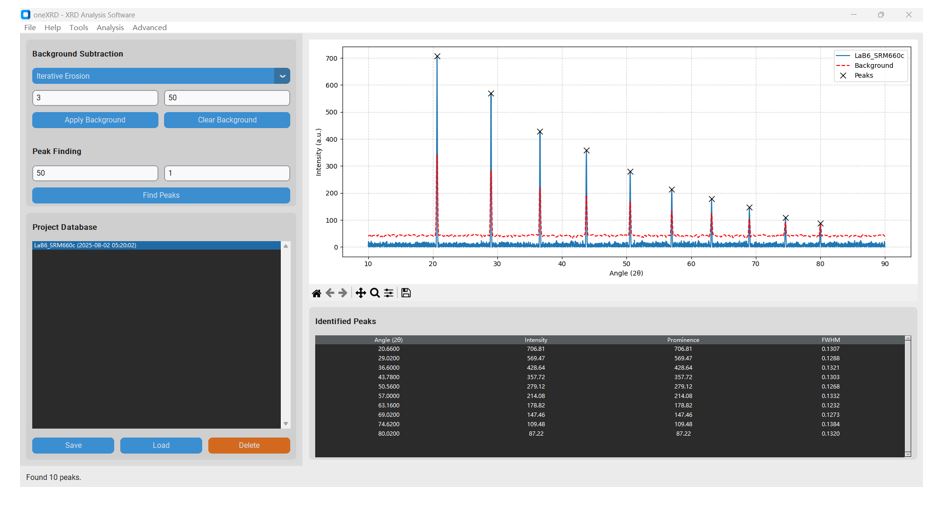
Figure 8: Processed XRD pattern of NIST SRM 660c (LaB₆) in oneXRD. The plot displays the raw experimental data, the calculated background (red dashed line) after iterative erosion, and the automatically identified peaks (black 'x' markers).
FIGURE 9
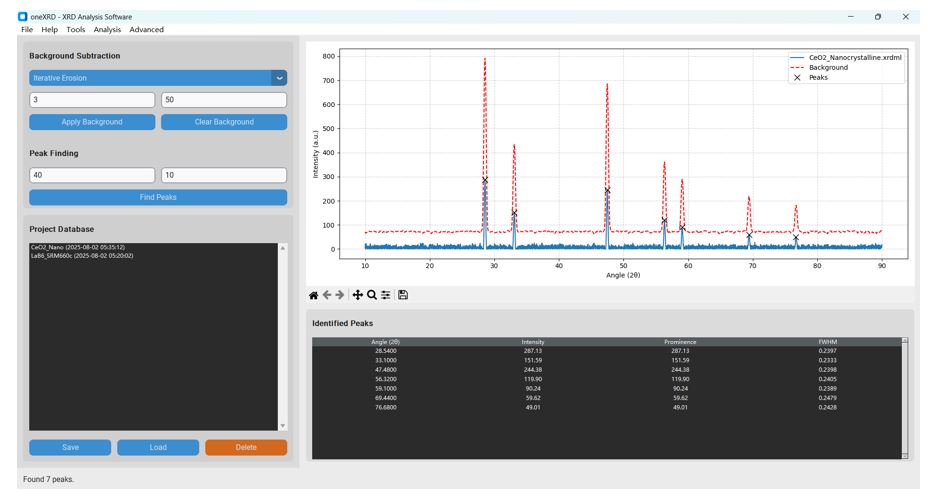
Figure 9: Processed XRD pattern of nanocrystalline CeO₂ in oneXRD. The plot shows the raw data, the subtracted background, and the seven peaks identified for analysis. The significant broadening of the peaks is visually apparent.
FIGURE 10
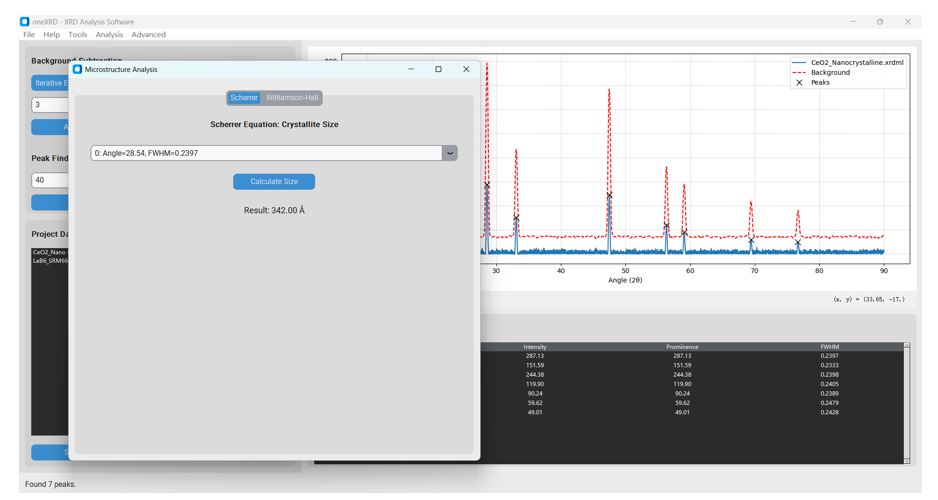
Figure 10: Scherrer analysis result in oneXRD. Using the (111) peak at 28.54° with an FWHM of 0.2397°, the calculated crystallite size is 342.00 Å (or 34.2 nm).
FIGURE 11
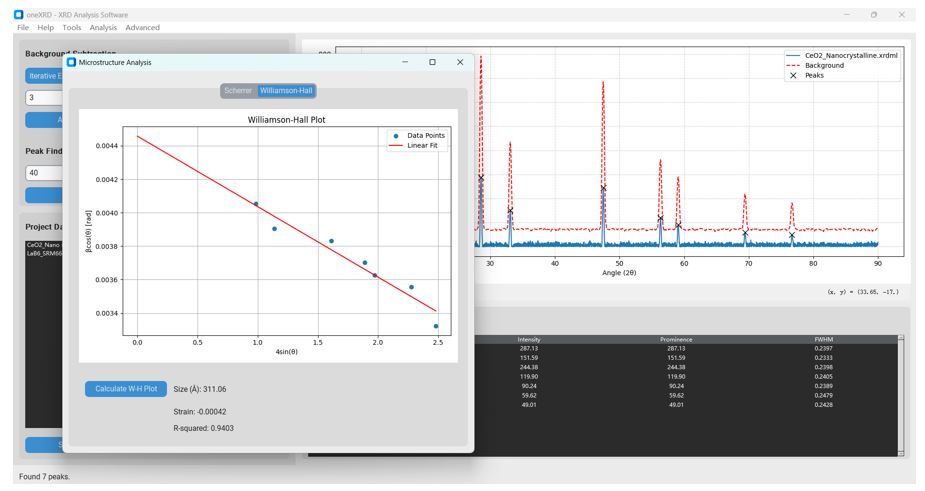
Figure 11: Williamson-Hall analysis result in oneXRD. The W-H plot shows a reasonable linear trend (R-squared = 0.9403). The analysis yields an average crystallite size of 311.06 Å (or 31.1 nm) and a microstrain of -0.00042 (or -0.042%).
FIGURE 12
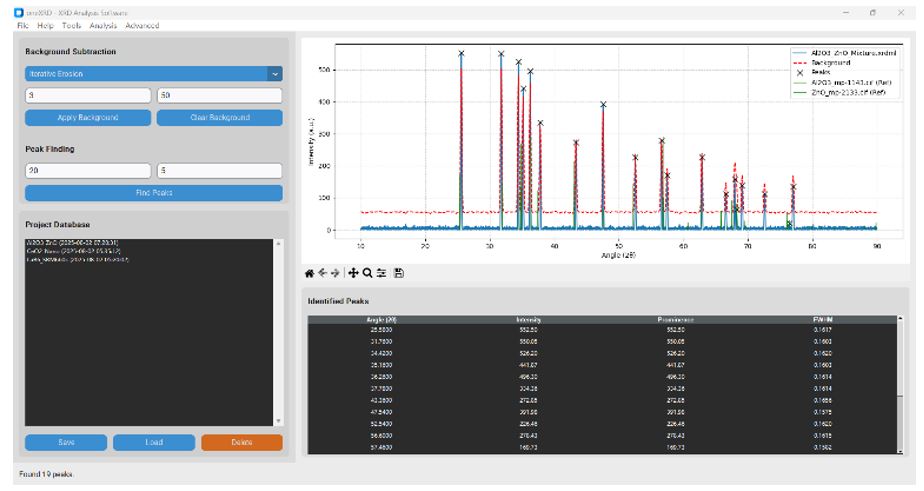
Figure 12: The oneXRD main window showing the fully prepared analysis. The experimental data from the mixture is plotted, the background is subtracted, peaks are found, and the two reference patterns for Al₂O₃ and ZnO are overlaid.
FIGURE 13
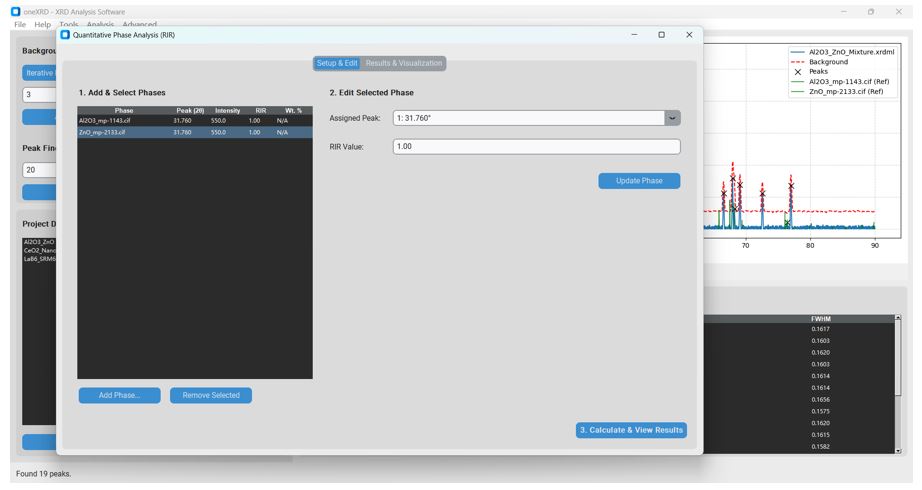
Figure 13: The "Setup & Edit" tab of the QPA plugin. This view demonstrates the seamless workflow where the two phases are preloaded. The user has assigned the appropriate experimental peaks to each phase using the "Inspector" panel.
FIGURE 14
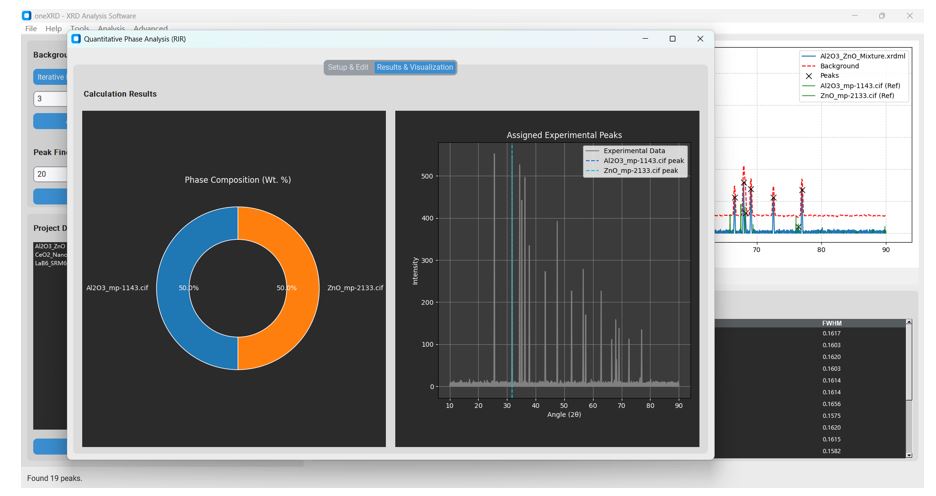
Figure 14: The "Results & Visualization" tab of the QPA plugin. After calculation, the plugin automatically switches to this dashboard, displaying a clear pie chart of the phase composition and a validation plot showing the location of the assigned peaks relative to the full experimental pattern.
FIGURE 15
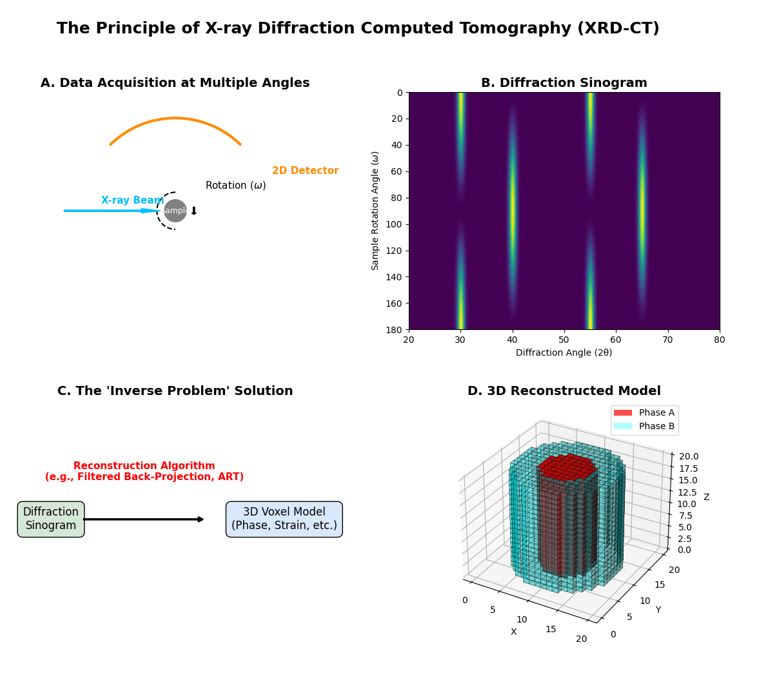
Figure 15: Schematic illustration of the X-ray Diffraction Computed Tomography (XRD-CT) process, the scientific basis for the 3D reconstruction feature in oneXRD.
(A) Data acquisition involves collecting a series of two-dimensional diffraction patterns while the sample is rotated through multiple angles (ω). Unlike medical CT which measures a single absorption value, each projection here contains a full diffraction pattern. (B) The collected data is arranged into a "Diffraction Sinogram," where each row represents a full 1D diffraction pattern (azimuthally integrated from the 2D detector) at a specific rotation angle. The sinusoidal traces indicate the changing orientation of different phases relative to the X-ray beam. (C) A reconstruction algorithm, such as Filtered Back-Projection or ART, is then employed to solve the complex "inverse problem," calculating the most probable diffraction properties for each internal point of the sample. (D) The final output is a 3D voxel model where each voxel contains structural information. This allows for the visualization of the spatial distribution of different phases (e.g., Phase A core in red, Phase B shell in cyan), crystallite orientation, or strain, effectively transforming 2D diffraction "fingerprints" into a 3D structural "body scan" of the material.
FIGURE 16
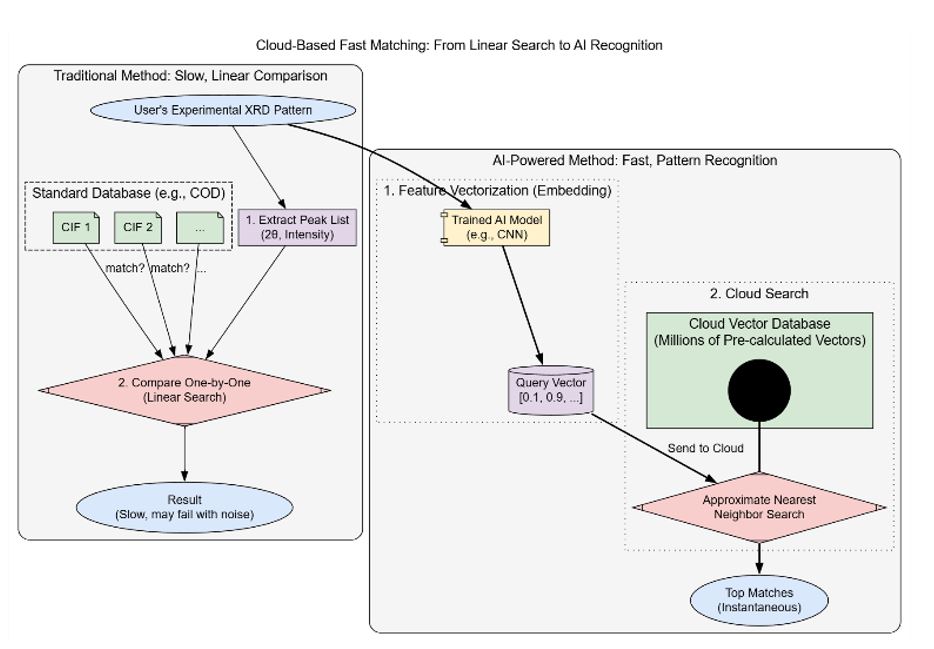
Figure 16: Comparison Flowchart for the Design of the oneXRD Cloud-based Rapid Comparison System
FIGURE 17
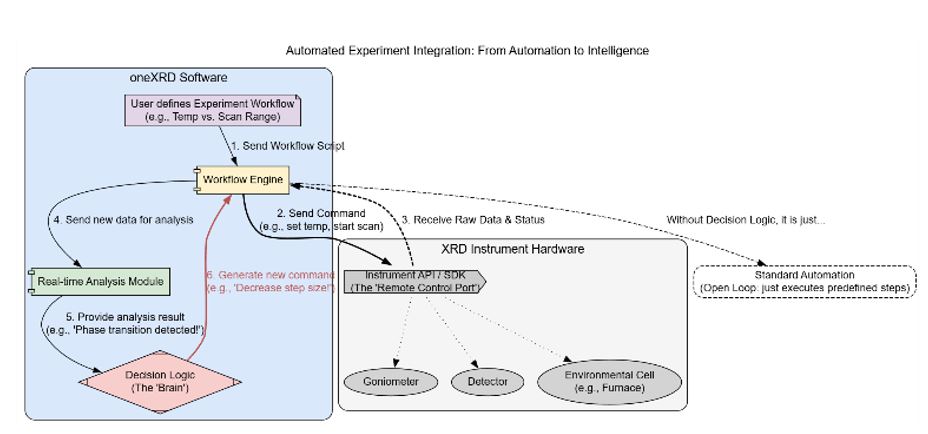
Figure 17: How oneXRD evolved from data analysis software into an experimental control and decision-making center.
FIGURE 18
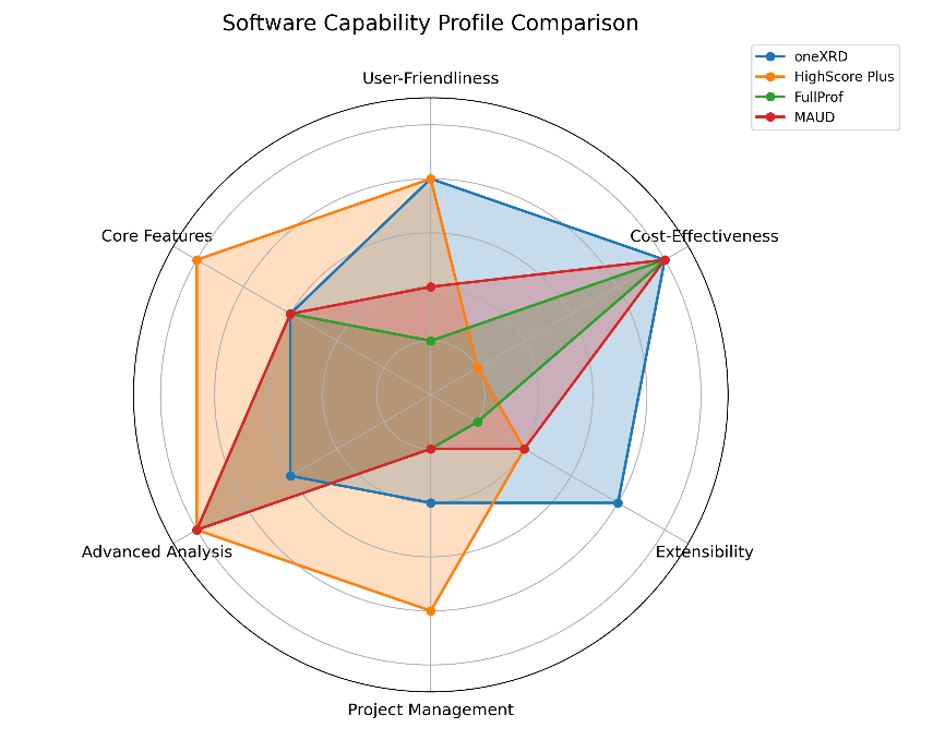
Figure18: A radar chart comparing the software capability profiles of oneXRD, HighScore Plus, FullProf, and MAUD across six key metrics. The diagram illustrates oneXRD's unique strategic position, scoring highly in User-Friendliness, Cost-Effectiveness, and Extensibility—areas where established tools show significant trade-offs. While the commercial HighScore Plus excels in features at a high cost, and the academic FullProf and MAUD offer powerful analysis with a steep learning curve, oneXRD provides a balanced, accessible, and powerful platform for modern XRD analysis.
Tables at a glance
Figures at a glance