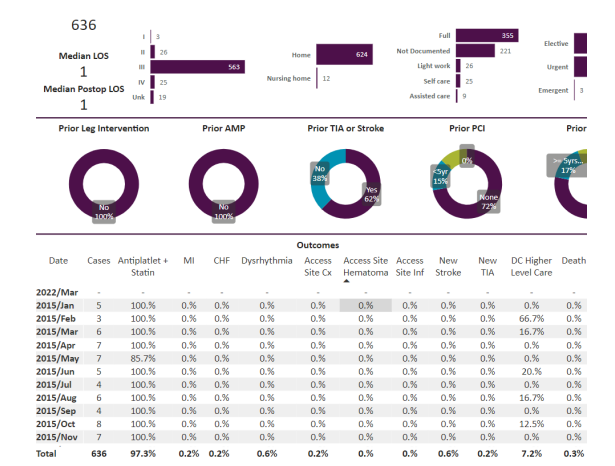
Figure 1: In the overall data of 636 patients, the stroke, death and TIA rates were only only 0.6%, 0.3% and 0.2% respectively.
Figure 1: In the overall data of 636 patients, the stroke, death and TIA rates were only only 0.6%, 0.3% and 0.2% respectively.
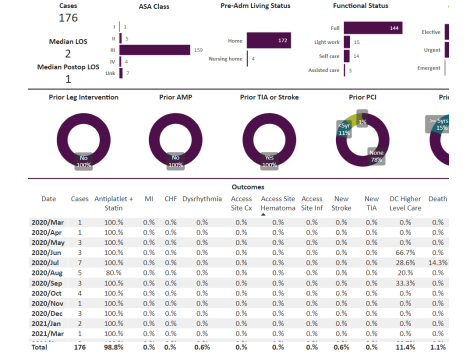
Figure 2: In the symptomatic 176 symptomatic patients, the stroke, death and TIA rates were 0.6%, 1.1% and 0%. The overall 30-day incidence of myocardial infarction was also extremely low given at 0%.

Figure 3: In the 201 asymptomatic patients, the stroke, death and TIA rates were 1%, 0% and 0.5%. The overall 30-day incidence of myocardial infarction was also extremely low given at 0%.
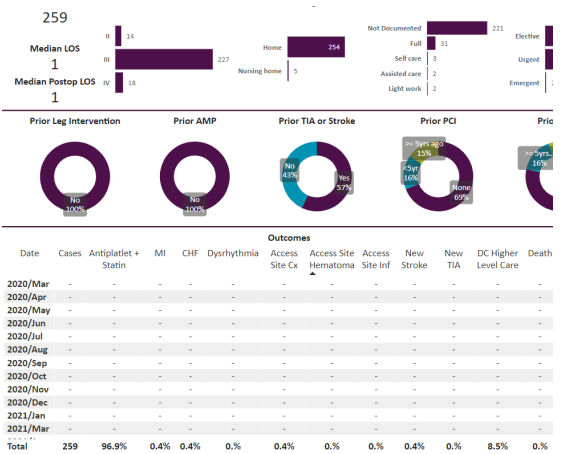
Figure 4: In the “other’ category of 259 patients who were not asymptomatic or symptomatic due to lack of adequate data to know if symptoms were within 6 months or not, the stroke, death and TIA rates were. The overall 30-day incidence of death and myocardial infarction was 0.4%, 0% and 0% respectively in this mixed patient population
Tables at a glance
Figures at a glance