Table 1: Demographic & risk factors comparison between different studied groups
Table 2: Comparison of all studied groups with respect to IVUS data
**KW: Kruskal Willis test.
*X2: Chi-square test
IQR: inter-quartile range
Table 3: Comparison of all studied groups regarding the success criteria
Table 4: Predictors of stent deployment failure
B: Regression coefficient, SE: Standard error, CI: Confidence interval.
Table 5: Predictors of stent deployment success & its impact on MBG
*X2: Chi-square test. ** MW: Mann–Whitney U test IQR: inter-quartile range
Table 6: Impact of lesion type & calcification on successful stent deployment
X2: Chi-square test.
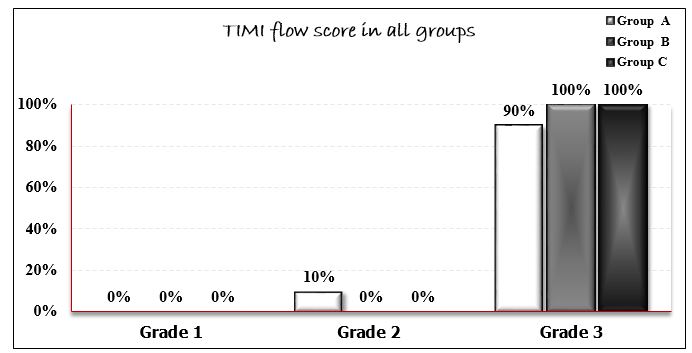
Figure 1: Comparison of all studied groups with respect to TIMI flow score.
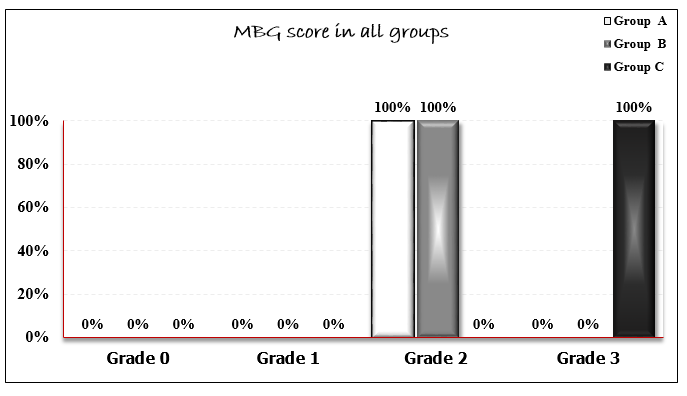
Figure 2: Comparison of all studied groups with respect to MBG score.
Tables at a glance
Figures at a glance