A Simple Approach for Detecting Left Ventricular Hypertrophy on ECG Based on Cardiac MRI
Received Date: March 17, 2026 Accepted Date: March 31, 2026 Published Date: April 03, 2026
doi:10.17303/jcvm.2026.12.104
Citation: Siyi Huang, John A. Ambrose, Asseel Albayati, Ashwini Sadhale, Sujana Balla, et al. (2026) A Simple Approach for Detecting Left Ventricular Hypertrophy on ECG Based on Cardiac MRI. J Cardio Vasc Med 12: 1-11
Abstract
Purpose: The diagnosis of LVH on ECG typically uses echocardiography as gold standard. MRI has been shown to be a better method of LVH determination than echocardiography. ECG/MRI comparisons for LVH typically use complex algorithms or machine learning. The purpose of the study was to develop a simpler method for diagnosing LVH on the 12-lead ECG with cMRI as reference.
Results: The 12-lead ECGs from 485 patients in whom cardiac MRI was performed and LV mass (LVH) determined were analyzed. The 4 traditional LVH criteria of Sokolow-Lyons, Romhilt-Estes, Cornell, and Peguero-LoPresti had sensitivities ranging from 13.5 to 33.3%, respectively, with high specificity (≥95%). Other criteria investigated had extremely low diagnostic accuracy. If any of these 4 traditional criteria were present, the sensitivity for an LVH diagnosis increased to 52% with a specificity of 90 % and an AUC of 0.71. Either left atrial enlargement or lateral T change alone or any of the 4 traditional criteria increased sensitivity for LVH to 60% at the cost of a lower specificity 79%. Adjustment for gender was noted only with Cornell criteria in females.
Conclusions: This study supports a simple method to diagnose LVH on ECG based on MRI by utilizing a combined approach with increased diagnostic accuracy present when any of the 4 traditional criteria are present. This is in comparison to any single traditional criteria. This method appears at least comparable to the more complex algorithms for LVH diagnosis that have been previously reported and should be considered in further LVH/MRI comparisons.
Keywords: Left Ventricular Hypertrophy; ECG; MRI; Echocardiography; Diagnosis
Introduction
For over 100 years, researchers have published on the diagnosis of left ventricular hypertrophy (LVH), or increased LV mass, utilizing the ECG as a screening tool. Initial correlations compared ECG criteria of QRS amplitude in various leads to a reference standard of either a clinical diagnosis or increased ventricular mass at autopsy data with later studies utilizing 2-dimensional echocardiography criteria. ECG criteria in several studies employed QRS voltage (amplitude) alone to diagnose LVH while other studies added other variables [1,2]. Romhilt and Estes developed a point score system incorporating additional clues on the ECG (QRS duration or changes in QRS vectors, repolarization or P wave abnormalities) to enhance voltage criteria in diagnosis2. Several other criteria exist in the literature for an ECG diagnosis of LVH and some considered different criteria for males and females. Most notably, Cornell criteria and Peguero-LoPresti developed sex-specific criteria for LVH based on differences in QRS amplitude in various ECG leads with the reference being 2-dimensional echocardiography. QRS voltage/criteria may also vary according to either race, body habitus, type of intraventricular conduction delay or patient’s age [3-8]. Most of the above LVH criteria pertain only to individuals at least 35 years of age.
While 2-dimensional echocardiography had been considered the “gold standard” for LV mass determination, it has recently been demonstrated that cardiac magnetic resonance imaging (MRI) is more accurate than 2- dimensional echocardiography for this determination [9,10]. MRI /ECG correlations of LVH, for the most part, have utilized complex algorithms or machine learning [10-13]. The purpose of this investigation was to assess whether one could develop a simpler method to diagnose LVH based on traditional ECG criteria.
Methods
A retrospective analysis of the 12-lead ECGs from all patients in whom cardiac MRI was performed at Community Regional Medical Center and LV mass was determined. The closest ECG to the cardiac MRI (cMRI) was analyzed. All ECGs other than LBBB and paced rhythm were included. ECGs were acquired on Phillips TC-70 EKG carts at 10 mm/mV calibration and a speed of 25mm/s. All ECGS were read by the same investigator (JA) blinded to the MRI data. A diagnosis of LVH was made based on the following analytic ECG criteria. MRI utilized standard definitions for LV mass in men and women.
Standard criteria definitions:
Sokolow-Lyon criteria [14]
S in V1 + R in V5 or V6 > 35 mm.
Romhilt-Estes (RE) criteria [2]
Score of 4: Indicates probable LVH.
Score of 5 or greater: Indicates definite LVH.
The RE score is based on nine criteria from a 12-lead ECG, including:
R or S wave: 3 points for any R or S wave ≥ 2.0 mv (20 mm) in limb lead; and > 3.0 mv (30 mm) in precordial leads.
ST-T wave changes: 3 points for secondary ST-T wave changes that are typical of LVH.
Left atrial abnormality: 3 points for P terminal force in V1 that is ≥ 1 mm in depth and lasts for ≥40 msec.
Left axis deviation: 2 points for left axis deviation that is ≥-30 degrees in the frontal plane.
Intrinsicoid deflection: 1 point for intrinsicoid deflection that is ≥ 0.05 sec.
Of note, for this analysis, intrinsicoid duration was not utilized as this was not easily measured on the 12-lead ECG.
Cornell criteria and Modified Cornell’s criteria [3,4]
R in aVL + S in V3 >20 mm in females, >28 mm in men.
Modified Cornell >12 mm in aVL.
Peguero-Lo Presti criteria [5]
Deepest S in any lead + S in V4 >22 mm in females, > 27 mm in men.
If none of the above were present, other criteria (designated A1 to A4) were considered for an LVH diagnosis:
A1: Other voltage criteria alone [15]
Max R + S in precordial Leads >45 mm
- R in V5 >26 mm
- R in V6 >20 mm
- Lead 1 + S in Lead II ≥26 mm
- R in Lead 1 ≥14 mm
- R in aVR ≥ 15mm
- R in aVF ≥ 21 mm
A2: Any voltage criteria in A1 with either left atrial abnormality or lateral T change.
A3: Left atrial abnormality alone without any voltage criteria.
A4: Lateral T changes alone suggestive of LVH (LV strain pattern) but without any voltage criteria.
MRI Criteria
Cardiac magnetic resonance (cMRI) examinations were performed using 1.5 Tesla General Electric MRI scanner. Imaging was performed with patients in the supine position, using a five-element cardiac phased-array coil and a vector cardiographic method for ECG gating. All acquisitions were obtained during breath holding in expiration. Retrospectively ECG gated long and short axis cine images were acquired using a steady-state free precession (SSFP) sequence based on standard protocol [16]. SSFP short-axis cine images, from the mitral valve plane through the apex were then prescribed from the previously acquired horizontal long-axis image for evaluation of ventricular volumes, structure, and function. Short-axis images were typically 8 mm thick with no inter-slice gap and a temporal resolution < 45 ms. The presence of myocardial scar was evaluated in participants. Scouting images were obtained in 2-chamber (vertical long axis) and 4-chamber plane who consented to contrast administration and without contraindication beginning 10 minutes after bolus administration of 0.2 mmol/kg gadopentetate dimeglumine (Bayer, New Jersey) using an inversion recovery prepared gradient echo sequence.
Image Analysis
A visual evaluation of the short and long-axis cine images was done for qualitative evaluation of the presence and distribution of hypertrophy, ventricular size, structure, and function. To minimize subjectivity in contour tracing, we used previously described criteria for the delineation of cardiac borders [16]. Left Ventricle Mass (LVM) was measured using the semiautomatic software tool. LVM was measured on all short axis images where the myocardium was present as a complete circle or near complete circle. All measurements were performed at end-diastole, which was identified as the frame with the largest left ventricular volume. The papillary muscles were included in the volume in all scans and were not a part of the LVM calculation. The LV and RV EDVs and ESVs were computed using a modified Simpson's rule. The LV and RV stroke volume (SV) and ejection fraction (EF) were calculated as SV = EDV – ESV, and EF = SV/EDV × 100%. LV mass was calculated as LV mass = 1.05 × (epicardial volume – endocardial volume). The RV mass was not measured in this study.
Left ventricular hypertrophy (LVH) is defined by an increased left ventricular (LV) mass: >152 g in males and >103 g in females. When indexed to body surface area (BSA), LVH is defined as an LV mass index >75 g/m² for males and >59 g/m² for females [17].
Patients with poor quality of cMRI images due to motion or technical reasons were not included in the study analysis. Patient with diagnosis of amyloid were also excluded from further study. Measurements were first obtained by a single primary reader. To assess intra- and inter-observer agreement, measurements were repeated by the primary reader and a second reader in randomly selected cases with a reproducibility >90%.
Statistical Analysis
Baseline patient characteristics were summarized using standard descriptive statistics, including frequencies, percentages, and means. Continuous variables were reported as mean ± standard deviation (SD), while categorical variables were presented as frequencies (percentages). The diagnostic performance of various ECG-LVH criteria was assessed against the reference standard of MRI diagnosis of LVH using sensitivity, specificity, positive predictive value, negative predictive value, and ROC curve analysis. Comparisons of AUCs across multiple ROC curves were performed using the chi-square test, accounting for paired data, and followed by pairwise comparisons. For unpaired data, the z-test was used. A p-value of <0.05 was considered statistically significant. Study data were collected and managed using RED Cap electronic data capture tools hosted at University of California San Francisco. All analyses were conducted using STATA statistical software (version 18; StataCorp).
Results
Study Sample and Baseline Characteristics
Between 13 June 2022 and 12 March 2024, a total of 728 cMRI studies were conducted at a single site. Of these, 243 subjects were excluded from further analysis for the following reasons: 34 due to poor imaging quality, 13 with amyloidosis, 11 with pacemakers, 4 with limited study scope, 2 with complex congenital heart diseases (1 hypo plastic left heart syndrome and 1 transposition of the great arteries), 3 pediatric patients (age <18 years), 174 with unavailable or non-current electrocardiograms (EKG). Consequently, 485 subjects (66.6%) were included in the final analysis (Figure 2).
The majority of patients were referred for cMRI to evaluate cardiomyopathy or arrhythmias. Specifically, 79 (16.3%) underwent evaluation for ischemic cardiomyopathy and/or viability, 107 (22.1%) for non-ischemic cardiomyopathy, 30 (6.2%) for hypertrophic cardiomyopathy, and 79 (16.3%) for arrhythmias.
The mean age of the study population was 56.6 ± 16.7 years, and 236 (49.7%) were female. The mean interval between ECG and cardiac MRI was 52.3 ± 2.17 days; 196 studies (40.4%) were conducted within 30 days, and 378 (77.9%) within 90 days. Among the cohort, 121 (25.0%) exhibited increased left ventricular (LV) mass, including 50 females. When indexed to body surface area (BSA), 111 (22.9%) showed increased LV mass index, of whom 43 were female (Table 1).
Diagnostic Performance of Standard ECG-LVH Criteria
Among the study population, 41 patients (8.5%) met the Cornell criteria, 38 patients (7.8%) met the Romhilt-Estes criteria, 19 patients (3.9%) met the Sokolow-Lyon criteria, and 57 patients (11.8%) met the Peguero-LoPresti criteria. A total of 96 patients (19.8%) satisfied at least one of these standard ECG-LVH criteria, with only 1 patient meeting all four criteria (Table 2).
The sensitivity, specificity, positive predictive value (PPV), negative predictive value (NPV), and area under the curve (AUC) for each individual ECG-LVH criterion, as well as combinations of criteria, in comparison to LVH diagnosed based on increased LV mass index using CMR, are presented in Table 2. Total LV mass also compared to LVH criteria (data not shown), but the results were similar to LV mass index.
The Peguero-LoPresti criteria demonstrated the highest sensitivity (33.3%), while the Sokolow-Lyon criterion had the highest specificity (98.9%). However, Sokolow-Lyon showed both the lowest sensitivity (13.5%) and overall AUC (0.56; P < 0.05). Although the Peguero-LoPresti criteria achieved the highest AUC (0.64), it did not demonstrate statistical significance compared to Cornell or Romhilt-Estes. All traditional criteria had a specificity of at least 95%.
Meeting at least one traditional ECG-LVH criterion resulted in the highest sensitivity (52.3%) and AUC (0.71; P < 0.05) (Figure 3). Conversely, meeting more than one criterion increased specificity but decreased sensitivity, leading to a lower overall AUC compared to meeting at least one criterion (Table 2). These findings were consistent when tested against increased LV mass as determined by cMRI and in subgroup analyses of male and female populations.
Diagnostic Performance of non-traditional LVH criteria (A1-A4)
Among the study population, 3 (0.6%), and 0 patients met A1 and A2 criteria, respectively. No patient simultaneously met more than one A1-A4 criterion. When at least one traditional ECG-LVH criteria or either the A3 or A4 criteria was met, the sensitivity for detecting LVH increased to 59.5 %. However, this improvement came at the cost of reduced specificity to 79.1% with an AUC of 0.69 %, resulting in no overall significant change in the AUC (Figure 3).
Male/Female Comparison
In the gender-based subgroup analysis, the Cornell criteria demonstrated superior diagnostic accuracy for detecting increased LV mass index in females compared to males; sensitivity 39.5% vs 16.2%, respectively with specificity for both >95% (AUC: 0.68 vs. 0.57, P = 0.01). No significant differences were observed between genders for the other criteria. Meeting at least one traditional ECG-LVH criterion showed the highest diagnostic accuracy across both genders (table 3).
Discussion
ECG analysis for LVH with cMRI should be a more accurate diagnostic tool for the clinician given its superiority to echocardiography as the reference standard. Published articles [18] report enhanced accuracy for diagnosing LVH based on machine learning or complex ECG algorithms not ascertained by simple 12 lead analysis [11]. However, even with the newer BART-LVH/MRI criteria (SV1+SV2+RV5 ≥4.2 mV), sensitivity was only 29% for LVH diagnoses which was higher than other traditional ECG-LVH criteria [12]. Most LVH definitions are based on voltage criteria alone although Romhilt-Estes added several additional criteria not contained in most other definitions. For example, in one of the largest ECG/MRI comparisons, Groningen investigators assessed Q wave, R and S wave amplitude in all 12 leads times QRS duration but did not include other non-voltage criteria such as left atrial abnormality or lateral t changes in their algorithm [11]. With their approach, sensitivity increased to 44% in men and 42% in women with a specificity of about 90%. Other studies in the past have utilized complex criteria based on computerized reading again with echocardiography as reference [13].
The present study assessed individual as well as combined traditional criteria for the most accurate LVH diagnosis. Combining criteria (Sokolow-Lyon and Cornell) was previously reported in a small trial based on echocardiography [19]. Given the superiority of cMRI for LVH diagnosis, the present study not only used traditional LVH criteria but explored some other published definitions to develop a simpler method for LVH detection based on visual and the standard computerized analysis of the 12-lead ECG. In the planning stage of the study, we asked the question as to what the clinician would want from this ECG/MRI analysis. Clinicians taking care of patients should not necessarily be concerned if a particular LVH criteria is met but whether or not there are any standard criteria for an LVH diagnosis. Assessing all standard criteria are necessary due to inherent potential changes on the 12-lead ECG in the presence of LVH. For example, if the mean precordial QRS vector is shifted to the left, downward and posteriorly, the ECG will show a precordial late transition with increased precordial S waves in the anterolateral leads [20]. In this situation, it would not be likely that precordial R waves would be increased leading neither to traditional Sokolow-Lyon nor Romhilt voltage for LVH but would favor Cornell or Peguero-LoPresti criteria. In other patients with high precordial R waves, Sokolow-Lyon or Romhilt would more likely suggest LVH than the other 2 traditional criteria. Other LVH criteria that required manipulation of the 12-lead ECG, such as multiplying Cornell voltage by QRS duration (Cornell voltage-duration product) [21], were not considered in this manuscript, as they did not align with our definition of a simplified, visually interpretable approach.
The key findings of our investigation included the following (Figure 4, central illustration):
- The 4 traditional LVH criteria (Sokolow-Lyon, Romhilt-Estes, Cornell and Peguero-LoPresti) in our population of patients had sensitivities ranging from 13.5 to 33.3%, respectively, with high specificity (≥95%). Other investigated criteria had extremely low diagnostic accuracy.
- If any of these 4 traditional criteria were present on the ECG, the sensitivity for an LVH diagnosis increased to 52% with a specificity of 90% and an AUC of 0.71.
- The presence of either left atrial enlargement or lateral T-change alone (A3 or A4) or any of the 4 traditional criteria increased sensitivity for LVH to 60% at the cost of a lower specificity 79% with an ROC of 0.69.
- Meeting at least 2 traditional LVH criteria increased the specificity to 98% with the highest combined positive and negative predictive values.
- Adjustment for gender was noted in this study only with Cornell criteria exhibiting greater diagnostic accuracy for LVH in female’s vs males.
While machine learning is complex, it is likely that it will further improve over time and replace a more simplistic approach such as the one outlined in this analysis [10,13,18]. Already, digital ECG machines have some degree of automated interpretation and they continue to evolve. However, determining which the most accurate method for LVH detection is will require additional study and a comparison of the different available criteria including the one suggested here. In the meantime, our findings indicate that a simple visual and standard computerized analysis of the 12-lead ECG can provide a high degree of accuracy comparable to that found in Groningen. The presence of any of the 4 traditional LVH criteria outperformed each individual traditional criteria based on cMRI as reference. The presence of left atrial enlargement or lateral T changes suggestive of LVH without any other LVH criteria increased the sensitivity of LVH but reduced the specificity. We believe these data support considering these combined approaches in all future ECG/LVH evaluations as well as in clinical practice and are at least comparable to the more complex algorithms previously reported.
Study Limitations
Several study limitations are recognized:
Acknowledgments
- In the literature, there are multiple articles regarding various ECG criteria for LVH that were not considered in this paper. These even include changes to the most well-known LVH traditional criteria studied here, altering their definitions. As this article was an attempt to provide the clinician with an easy and accurate method to define LVH on the ECG, only the traditional definitions were considered as outlined in the method’s section with the inclusion of a few other criteria appearing in articles and textbooks. Our study indicates that these other criteria were not useful for LVH diagnosis.
- BMI and race were not considered in the paper regarding the results.
- It is also recognized that there can be daily changes in QRS voltage in LVH [22]. However, all EKG/LVH criteria, based either on echocardiography or MRI correlation, have utilized a single EKG in diagnosis.
- This retrospective evaluation should be prospectively evaluated in subsequent analyses in a large sample size. Furthermore, given the retrospective nature of this study, one cannot exclude the possibility of selection bias. Future studies should select patients on the basis of common LVH diagnoses such as hypertension, valve disease, and dilated cardiomyopathy.
No acknowledgements.
Declaration of Interest statement
All authors declare no conflict of interest.
Funding
This research did not receive any specific grant from funding agencies in the public, commercial, or non-profit sectors.
Author Contributions
All authors had access to the data and contributed to the writing of this manuscript.
- Bacharova L, Schocken D, Estes EH, Strauss D (2014) The role of ECG in the diagnosis of left ventricular hypertrophy. Curr Cardiol Rev. 10: 257-61.
- Romhilt DW, Estes EH (1968) A point-score system for the ECG diagnosis of left ventricular hypertrophy. Am Heart J. 75: 752-58.
- Casale PN, Devereux RB, Kligfield P, et al. (1985) Electrocardiographic detection of left ventricular hypertrophy: development and prospective validation of improved criteria. J Am Coll Cardiol. 6: 572-80.
- Rodrigues SL, Angelo LCS, Baldo MP, et al. (2013) Detection of left ventricular hypertrophy by the R-wave voltage in lead aVL: population-based study. Clin Res Cardiol. 102: 653-9.
- Peguero JG, Lo Presti S, Perez J, Issa O, Brenes JC, Tolentino A (2017) Electrocardiographic Criteria for the Diagnosis of Left Ventricular Hypertrophy. J Am Coll Cardiol. 69: 1694-703.
- Hancock EW, Deal BJ, Mirvis DM, et al. (2009) AHA/ACCF/HRS recommendations for the standardization and interpretation of the electrocardiogram: part V: electrocardiogram changes associated with cardiac chamber hypertrophy: a scientific statement from the American Heart Association Electrocardiography. J Am Coll Cardiol. 53: 992-1002.
- Spencer CGC, Beevers DG, Lip GYH (2004) Ethnic differences in left ventricular size and the prevalence of left ventricular hypertrophy among hypertensive patients vary with electrocardiographic criteria. J Hum Hypertens. 18: 631-6.
- Alame AJ, Garg S, Kozlitina J, et al. (2018) Association of African Ancestry With Electrocardiographic Voltage and Concentric Left Ventricular Hypertrophy: The Dallas Heart Study. JAMA Cardiol. 3: 1167-73.
- Vogelsberg H, Mahrholdt H, Deluigi CC, et al. (2008) Cardiovascular magnetic resonance in clinically suspected cardiac amyloidosis: noninvasive imaging compared to endomyocardial biopsy. J Am Coll Cardiol. 51: 1022-30.
- Khurshid S, Friedman S, Pirruccello JP, et al. (2021) Deep Learning to Predict Cardiac Magnetic Resonance-Derived Left Ventricular Mass and Hypertrophy From 12-Lead ECGs. Circ Cardiovasc Imaging. 14: e012281.
- van der Ende MY, Hendriks T, van de Vegte Y, Lipsic E, Snieder H, van der Harst P (2021) The Groningen electrocardiographic criteria for left ventricular hypertrophy: a sex-specific analysis. Sci Rep. 11: 6662.
- Sparapani R, Dabbouseh NM, Gutterman D, et al. (2019) Detection of Left Ventricular Hypertrophy Using Bayesian Additive Regression Trees: The MESA. J Am Heart Assoc. 8: e009959.
- Liu C-M, Hsieh M-E, Hu Y-F, et al. (2022) Artificial Intelligence-Enabled Model for Early Detection of Left Ventricular Hypertrophy and Mortality Prediction in Young to Middle-Aged Adults. Circ Cardiovasc Qual Outcomes. 15: e008360.
- SOKOLOW M, LYON TP (1949) The ventricular complex in left ventricular hypertrophy as obtained by unipolar precordial and limb leads. Am Heart J. 37: 161-86.
- O’keefe J (2017) The Complete Guide to ECGs. 3rd ed. Jones & Bartlett Learning.
- Schulz-Menger J, Bluemke DA, Bremerich J, et al. (2020) Standardized image interpretation and post-processing in cardiovascular magnetic resonance - 2020 update : Society for Cardiovascular Magnetic Resonance (SCMR): Board of Trustees Task Force on Standardized Post-Processing. J Cardiovasc Magn Reson. 22: 19.
- Kawel-Boehm N, Hetzel SJ, Ambale-Venkatesh B, et al. (2020) Reference ranges (“normal values”) for cardiovascular magnetic resonance (CMR) in adults and children: 2020 update. J Cardiovasc Magn Reson. 22: 87.
- Rabkin SW (2024) Searching for the Best Machine Learning Algorithm for the Detection of Left Ventricular Hypertrophy from the ECG: A Review. Bioeng (Basel, Switzerland). 11.
- Schillaci G, Verdecchia P, Borgioni C, et al. (1994) Improved electrocardiographic diagnosis of left ventricular hypertrophy. Am J Cardiol. 74: 714-9.
- Yu Z, Song J, Cheng L, et al. (2021) Peguero-Lo Presti criteria for the diagnosis of left ventricular hypertrophy: A systematic review and meta-analysis. PLoS One. 16: e0246305.
- Molloy TJ, Okin PM, Devereux RB, Kligfield P (1992) Electrocardiographic detection of left ventricular hypertrophy by the simple QRS voltage-duration product. J Am Coll Cardiol. 20:1180-6.
- Farb A, Devereux RB, Kligfield P (1990) Day-to-day variability of voltage measurements used in electrocardiographic criteria for left ventricular hypertrophy. J Am Coll Cardiol. 15: 618-23.
FIGURE 1
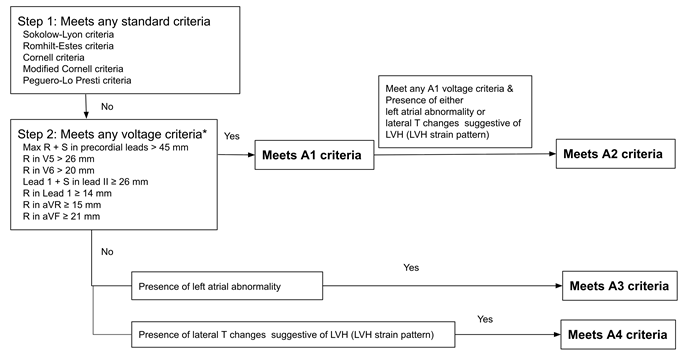
Figure 1: Stepwise algorithm for ECG-based LVH detection incorporating standard and additional (A1–A4) criteria
* A1–A4 represent additional criteria applied only when standard criteria are not met.
FIGURE 2
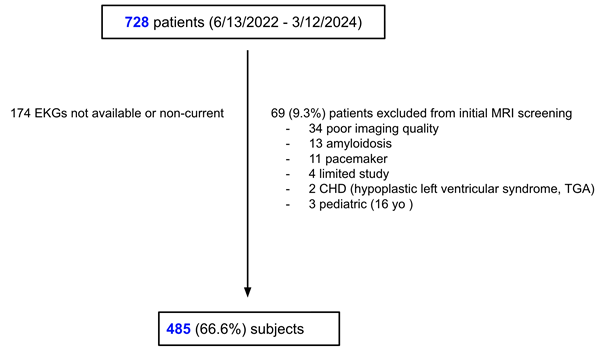
Figure 2: Flowchart of patient enrollment
FIGURE 3
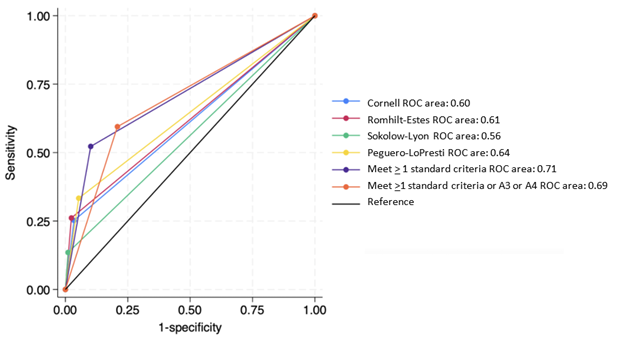
Figure 3: ROC curve analysis of ECG-LVH criteria for detecting elevated LV mass index. A3: represents left atrial enlargement (LAE), A4: represents lateral T-wave changes.
FIGURE 4
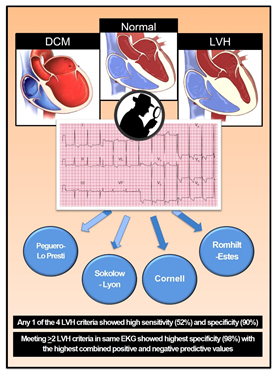
Figure 4: Central illustration. DCM: Dilated Cardiomyopathy, LVH: Left Ventricular Hypertrophy.
Tables at a glance
Figures at a glance