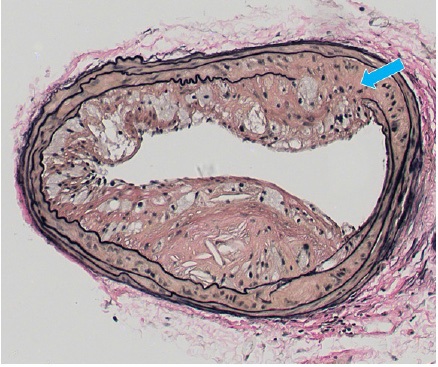
Figure 1 Brachiocephalic artery of ApoE KO/Tg mouse 20 weeks on high fat diet. Verhoeff-Van Gieson stain. Example of Grade 2 plaque with necrotic core containing cholesterol clefts. Arrow indicates IEM disruption.
Figure 1 Brachiocephalic artery of ApoE KO/Tg mouse 20 weeks on high fat diet. Verhoeff-Van Gieson stain. Example of Grade 2 plaque with necrotic core containing cholesterol clefts. Arrow indicates IEM disruption.
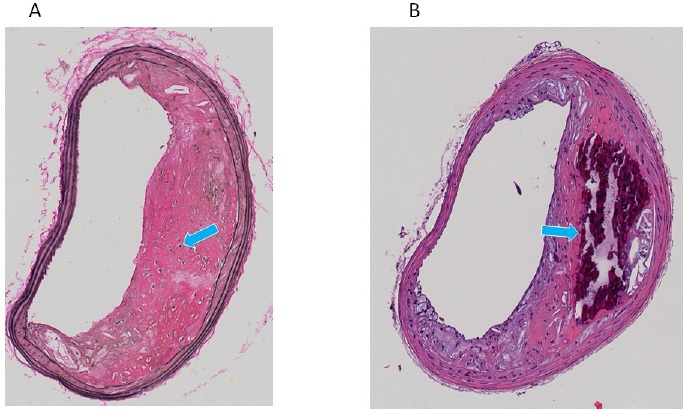
Figure 2 Brachiocephalic arteries of ApoE KO mice 40 weeks on high fat diet. Arrow indicates (A) chondrocyte-like cells or (B) calcification.
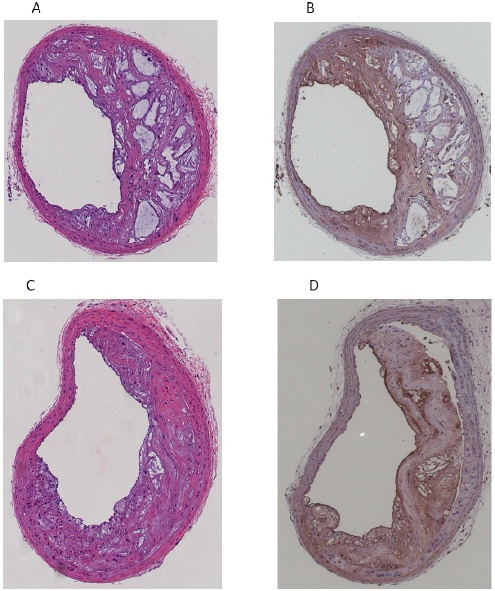
Figure 3 Brachiocephalic arteries of ApoE KO/Tg mice 40 weeks on high fat diet. (A,C) Hematoxylin & Eosin. (B,D) Immunohistochemistry for macrophages (F4/80)
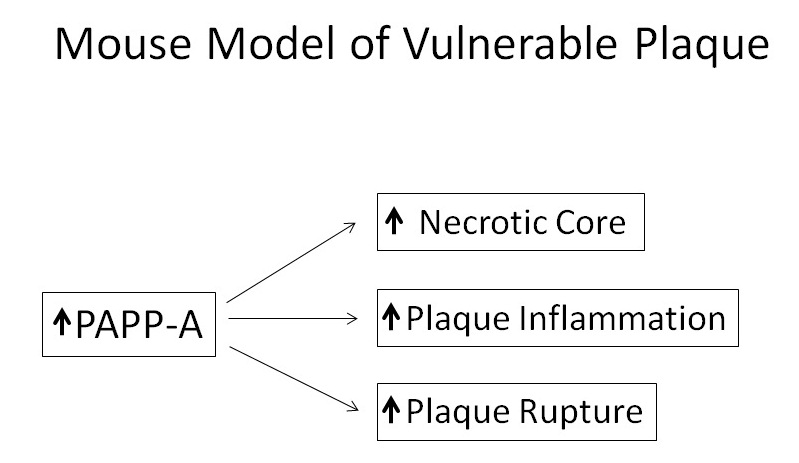
Figure 4Summary of the effect of PAPP-A overexpression in arterial smooth muscle on atherosclerotic plaque morphology in ApoE KO mice.
Lumin |
Thrombus (0 = no, 1 = yes) |
Intima |
Plaque (0 = absent, 1 = eccentric, 2 = concentric, 3 = both 1 & 2) |
Internal Elastic Membrane (IEM) |
Fragmentation/disruption (0 = absent, 1 = present) |
Media |
Thinning under the plaque (0 = absent, 1 = present) |
Adventitia |
Inflammation (0 = absent, 1 = chronic, 2 = acute, 3 = both 1 and 2) |
Table 1: Spreadsheet key for morphological analysis of brachiocephalic arteries in atherogenic mice.
Grams |
|||
|
Start |
20 weeks |
40 weeks |
Males |
|||
ApoE KO |
28.7 + 0.79 |
48.9 + 3.39 |
52.1 + 4.67 |
ApoE KO/Tg |
26.1 + 0.81 |
44.3 + 3.29 |
50.4 + 4.51 |
Females |
|||
ApoE KO |
22.1 + 0.55 |
35.9 + 3.69 |
41.0 + 5.72 |
ApoE KwO/Tg |
21.0 + 0.45 |
32.5 + 2.05 |
43.6 + 5.77 |
Table 2: Body weights of ApoE KO and ApoE KO/PAPP-A Tg mice at 7 weeks-of-age and after 20 weeks and 40 weeks of high fat diet.
|
% of Mice |
|
|
ApoE KO (21) |
ApoE KO/Tg (18) |
Plaque Grade |
|
|
1 |
45% |
12% |
2 |
45% |
25% |
3 |
-- |
52% |
4 |
9% |
-- |
Necrotic Core |
9% |
75%* |
IEL Disruption |
55% |
50% |
Chondrocyte-like Cells |
18% |
-- |
Calcification |
-- |
-- |
Plaque Inflammation |
-- |
-- |
Plaque Progression |
-- |
25% |
Adventitial Inflammation |
-- |
-- |
Table 3: Results from (N) mice are expressed as % of mice with the indicated morphology. *P = 0.002
|
% of Mice |
|
|
ApoE KO (14) |
ApoE KO/Tg (14) |
Plaque Grade |
|
|
1 |
7% |
-- |
2 |
57% |
36% |
3 |
14% |
64% |
4 |
14% |
-- |
Necrotic Core |
100% |
100% |
IEL Disruption |
57% |
79% |
Chondrocyte-like Cells |
93% |
64% |
Calcification |
43% |
43% |
Plaque Inflammation |
7% |
29%‡ |
Plaque Progression |
29% |
64%‡ |
Adventitial Inflammation |
29% |
29% |
Table 4: Results from (N) mice are expressed as % of mice with the indicated morphology. ‡P = 0.07