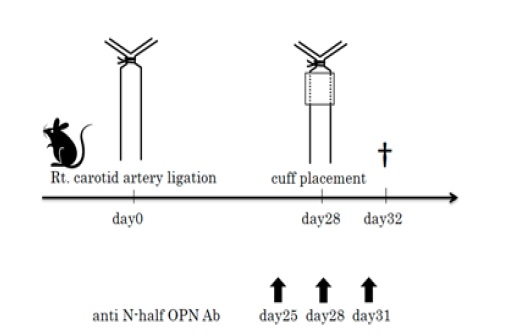
Figure 1A Experimental protocol of the present in vivo study
Figure 1A Experimental protocol of the present in vivo study
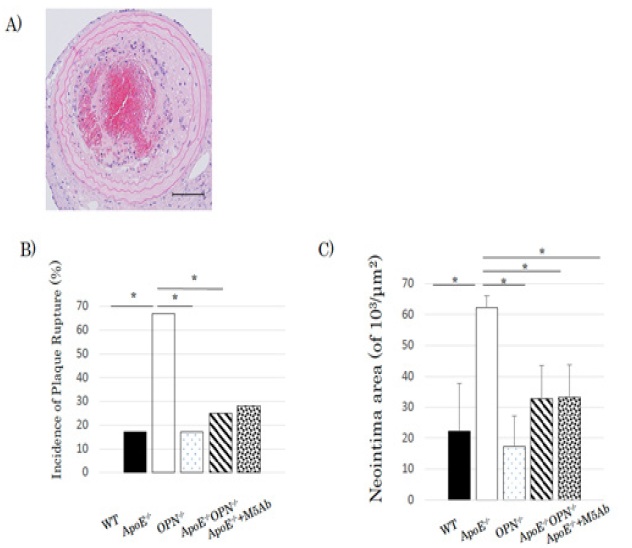
Figure 2 Plaque rupture and neointimal area
A) A representative carotid artery plaque rupture stained with hematoxylin and eosin. Several typical morphological changes, including intraplaque hemorrhage, cracks of neointima, and thrombus formation in the lumenare observed. Scale bar, 100 μm.
B) Incidence of plaque rupture was determined in wild type(n = 12), ApoE-/- (n = 12), Opn-/-(n = 12), ApoE-/-/Opn-/- (n = 12) mice, and in ApoE-/- animals treated with M5Ab (n = 7). The incidence of plaque rupture with thrombus in ApoE-/- mice was significantly higher than in wild type animals. In ApoE-/-/Opn-/-mice, the incidence of plaque rupture was significantly lower than in ApoE-/- mice and similar to that observed inApoE-/- mice treated with M5Ab.Statistical significance is indicated as follows: *P< 0.05 (for categorical variables, groups were compared using a chi-squared test).
C) Neointima area was measured in wild type, ApoE-/-, Opn-/-, ApoE-/-/Opn-/- mice, and in ApoE-/- animals treated with M5Ab. Neointima area in ApoE-/-mice was significantly larger than in all other groups (P< 0.05), whereas no other inter-group differences were observed. Data are presented the mean ±standard error of the mean. n = 7 in each group. Statistical significance is indicated as follows: *P< 0.05 (one-way analysis of variance followed by post hoc Scheffe’s test).
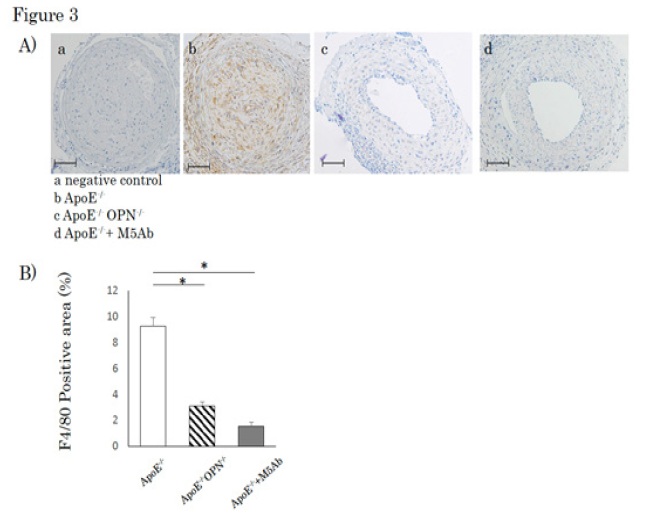
Figure 3 Immunohistochemistry by anti-F4/80
A) Representative images of F4/80-positive expression in ApoE-/-(b),ApoE-/-/Opn-/-(c), and ApoE-/- + M5Ab (d) groups. (a) negative control.
B) Plot of F4/80-positive area in samples from ApoE-/-, ApoE-/-/Opn-/-, and ApoE-/- + M5Ab groups. Note the significantly higher F4/80 levels in untreated ApoE-/- mice. Data are presented the mean ±standard error of the mean. n=5 in each group. Statistical significance is indicated as follows: *P< 0.05 (one-way analysis of variance followed by post hoc Scheffe’s test). Scale bar, 100 μm.
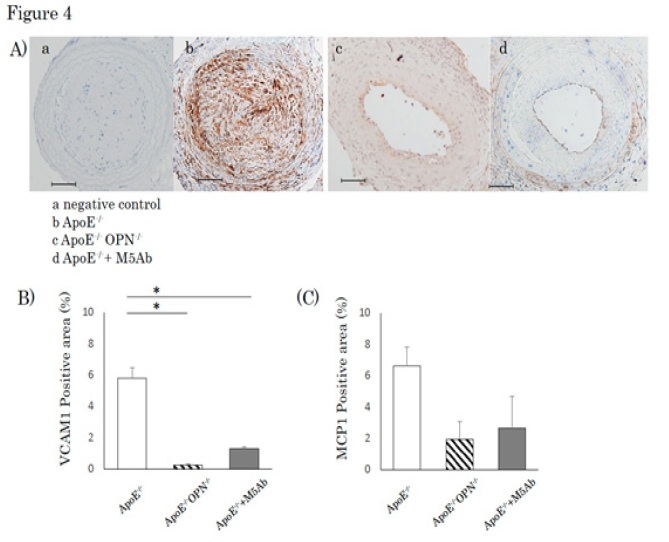
Figure 4Immunohistochemistry by anti-VCAM-1
A) Representative images of VCAM-1 expression in ApoE-/-(b), ApoE-/-/Opn-/-(c), and ApoE-/- + M5Ab (d) groups are illustrated.(a) negative control.(B) Plot of VCAM-1-positive area in samples from ApoE-/-, ApoE-/-/Opn-/-, and ApoE-/- + M5Ab groups. Note the significantly higher VCAM-1 expressionin untreated ApoE-/- mice. Data are presented the mean ±standard error of the mean. n=5 in each group. Statistical significance is indicated as follows: *P< 0.05 (one-way analysis of variance followed by post hoc Scheffe’s test). (C) Plot of MCP1-positive area in samples from ApoE-/-, ApoE-/-/Opn-/-, and ApoE-/- + M5Ab groups. Data represent the mean ±standard error of the mean. n=5 in each group. (one-way analysis of variance followed by post hoc Scheffe’s test). Scale bar 100 μm.