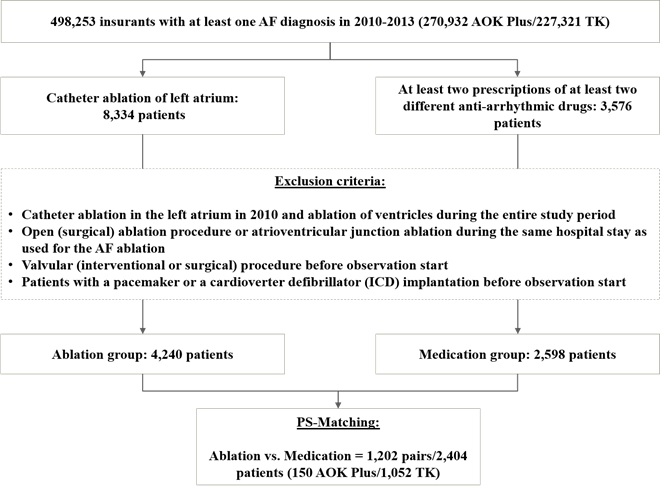
Figure 1 Sample definition
Figure 1 Sample definition
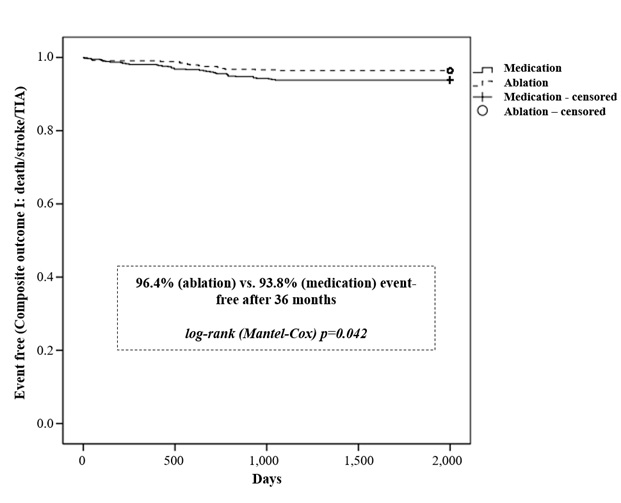
Figure 2 Kaplan-Meier curve of the time to first event (Composite outcome I: death/stroke/ TIA); only patients with a 36 months’ follow-up period were included (N=530/629)
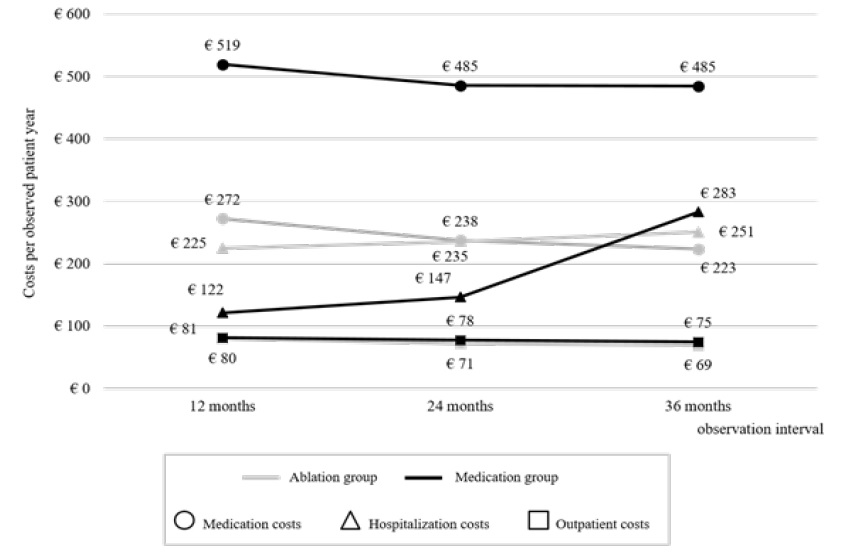
Figure 3 Development of costs per observed patient year, separately for medication, hospitalization and outpatient costs
|
Dataset: AOK Plus |
Dataset: TK |
Combined datasets |
|||
Ablation group |
Medication group |
Ablation group |
Medication group |
Ablation group |
Medication group |
|
Number of all identified patients |
905 |
638 |
3,335 |
1,960 |
4,240 |
2,598 |
Number of patients after propensity score matching (PSM) |
150 |
150 |
1,052 |
1,052 |
1,202 |
1,202 |
observable for at least 24 months |
92 |
111 |
864 |
876 |
956 |
987 |
observable for at least 36 months |
32 |
65 |
498 |
564 |
530 |
629 |
Average observational period (days) |
818.47 |
936.93 |
952.23 |
962.96 |
935.54 |
959.71 |
Mean age in years (1) |
67.81 |
67.57 |
63.60 |
64.61 |
64.12 |
64.98 |
Gender,n(%)Male Female |
71 (47.33%) 79 (52.67%) |
78 (52.0%) 72 (48.0%) |
664 (63.12%) 388 (36.88%) |
693 (65.87%) 359 (34.13%) |
735 (61.15%) 467 (38.85%) |
771 (64.14%) 431 (35.86%) |
Table 1: Descriptive characteristics of included AF patients
1 Based on index date (start of observation).
Objectives |
Observation period1 |
Ablation group |
Medication group |
p-value2 |
Composite outcome I3 |
12 months (%) |
13 (1.08%) |
21 (1.75%) |
0.226 |
24 months (%) |
26 (2.72%) |
39 (3.95%) |
0.165 |
|
36 months (%) |
19 (3.58%) |
39 (6.20%) |
0.043 |
|
Death |
12 months (%) |
7 (0.58%) |
16 (1.33%) |
0.092 |
24 months (%) |
14 (1.46%) |
31 (3.14%) |
0.015 |
|
36 months (%) |
9 (1.70%) |
30 (4.77%) |
0.005 |
|
Stroke |
12 months (%) |
4 (0.33%) |
4 (0.33%) |
1 |
24 months (%) |
8 (0.84%) |
7 (0.71%) |
0.800 |
|
36 months (%) |
9 (1.70%) |
10 (1.59%) |
1 |
|
TIA |
12 months (%) |
2 (0.17%) |
1 (0.08%) |
1 |
24 months (%) |
4 (0.42%) |
1 (0.10%) |
0.211 |
|
36 months (%) |
2 (0.38%) |
1 (0.16%) |
0.596 |
|
Myocardial infarction |
12 months (%) |
28 (2.33%) |
21 (1.75%) |
0.387 |
24 months (%) |
32 (3.35%) |
32 (3.24%) |
0.900 |
|
36 months (%) |
31 (5.85%) |
27 (4.29%) |
0.279 |
|
Arterial embolism |
12 months (%) |
2 (0.17%) |
4 (0.33%) |
0.687 |
24 months (%) |
5 (0.52%) |
5 (0.51%) |
1 |
|
36 months (%) |
3 (0.57%) |
7 (1.11%) |
0.360 |
|
Pacemaker / ICD |
12 months (%) |
11 (0.92%) |
15 (1.25%) |
0.555 |
24 months (%) |
13 (1.36%) |
22 (2.23%) |
0.389 |
|
36 months (%) |
15 (2.83%) |
22 (3.50%) |
0.616 |
|
Syncope |
12 months (%) |
1 (0.08%) |
5 (0.42%) |
0.218 |
24 months (%) |
4 (0.42%) |
7 (0.71%) |
0.548 |
|
36 months (%) |
4 (0.75%) |
11 (1.75%) |
0.192 |
|
Cardiac arrhythmia |
12 months (%) |
56 (4.66%) |
32 (2.66%) |
0.009 |
24 months (%) |
63 (6.59%) |
36 (3.65%) |
0.003 |
|
36 months (%) |
43 (8.11%) |
37 (5.88%) |
0.136 |
|
Composite outcome II4 |
12 months (%) |
102 (8.49%) |
82 (6.82%) |
0.125 |
24 months (%) |
118 (12.34%) |
109 (11.04%) |
0.373 |
|
36 months (%) |
87 (16.42%) |
113 (17.97%) |
0.487 |
|
Cardiology costs5 |
Ø costs per patient in 12 months |
€576.35 |
€718.56 |
0.045 |
Ø costs per patient in 24 months |
€1,085.71 |
€1,403.63 |
0.051 |
|
Ø costs per patient in 36 months |
€1,618.41 |
€2,462.15 |
0.007 |
|
Pneumonia |
12 months (%) |
6 (0.50%) |
4 (0.33%) |
0.753 |
24 months (%) |
8 (0.84%) |
8 (0.81%) |
1 |
|
36 months (%) |
7 (1.32%) |
8 (1.27%) |
1 |
Table 2: Observed event rates and costs
1 % in 12 months based on N=1,202/1,202;% in 24 months based on N=956/987; % in 36 months based on N=530/629
2p-value: Fisher’s exact Test/t-Test (costs); significant values are highlighted
3Composite Outcome I: death and/or occurrence of TIA and/or stroke
4Composite Outcome II: patient was affected byany of the secondary events (death/stroke/TIA/myocardial infarction/arterial embolism/pacemaker surgeries/syncope/cardiac arrhythmia)
5Cardiology-caused costs: inpatient costs with diagnoses referred to eventdefinition, medication costs with ATC-Codes C- and outpatient costs (only visits at cardiologist or neurologist)