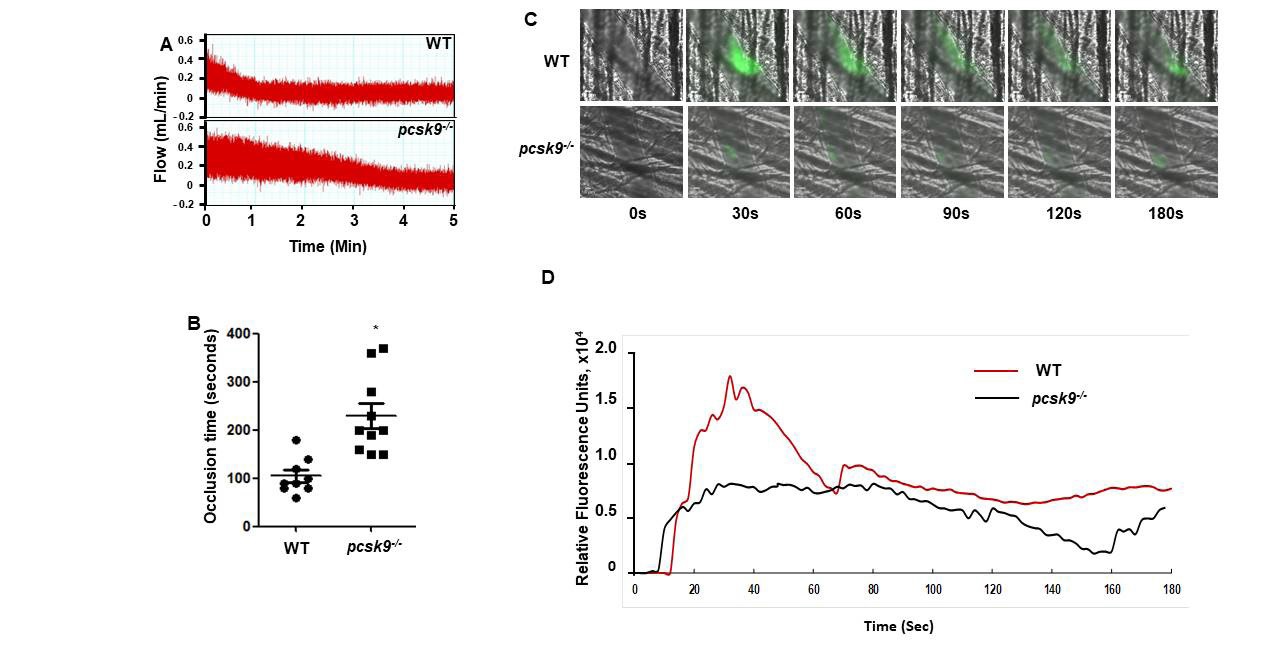
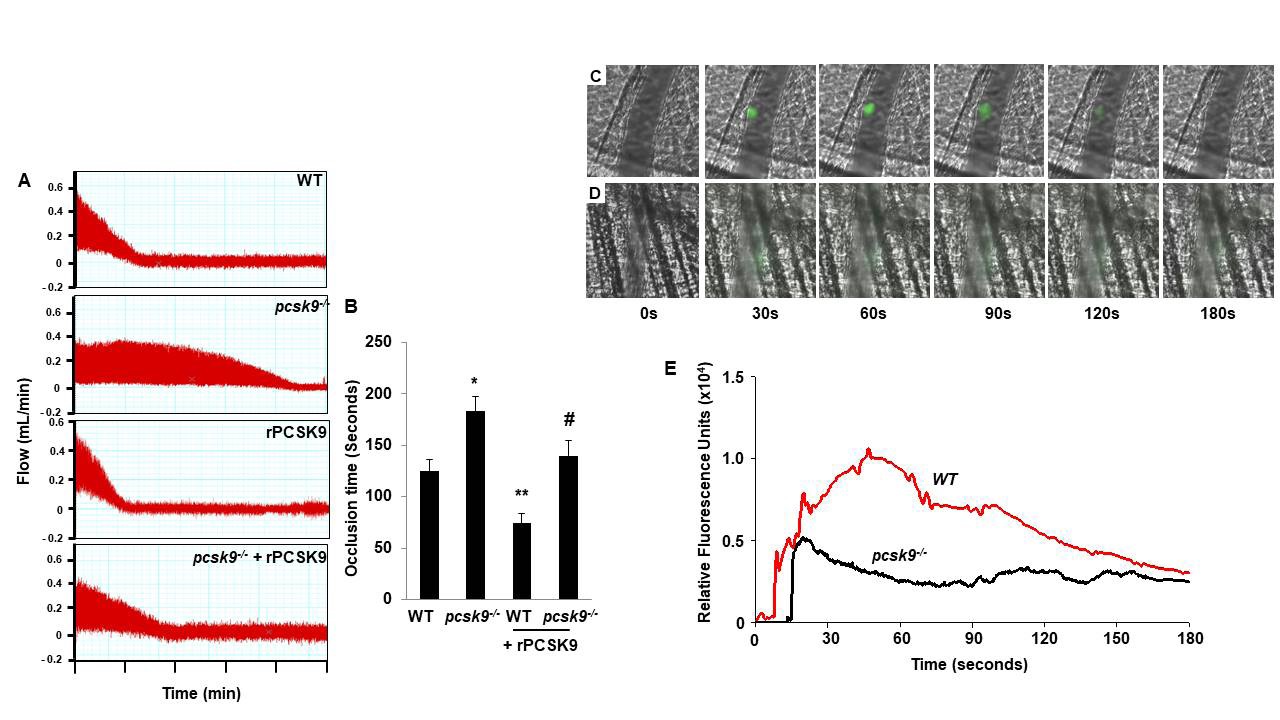
PCSK9 regulates thrombus formation in mice fed normal chow. (A) Recombinant PCSK9 (30 μg) or vehicle control was administered to WT mice via the tail vein 5 min before injuring carotid arteries with topical FeCl3. Carotid blood flow tracings are shown. (B) Mean carotid artery occlusion times after FeCl3 injury (n=11/group); *P<0.05 vs vehicle control group; **P>0.05 vs vehicle control group; #P<0.05 vs vehicle control group. WT, n=5; pcsk9-/-, n=13; pcsk9-/- + rPCSK9, n=7. The data were shown as mean ± SEM. *P<0.05 vs WT; #P<0.05 vs pcsk9-/- mice that did not receive rPCSK9. WT, wild-type. (C) Time-lapse images showing formation of platelet thrombus (green) in a cremasteric arteriole of a WT mouse after laser injury. Alexa Fluor 488-conjugated anti-CD41 antibody was used to label platelets. Scale bar (shown in 0s images) = 10 μm. (D) Corresponding images of a laser-injured cremasteric arteriole of a pcsk9-/- mouse. (E) Median integrated platelet fluorescence intensity (thrombus formation) in cremasteric arterioles after laser injury (n=3 mice/group). s, seconds; WT, wild-type.
PCSK9 deficiency delays thrombosis in mice fed a western diet. (A) Representative blood flow tracings after FeCl3 injury of carotid arteries of mice with indicated genotypes. (B) Aggregate carotid artery occlusion time data; WT, n=9; pcsk9-/-, n=10. Mean of each group is indicated by a horizontal bar; The data were shown as mean ± SEM. *P<0.05 vs. WT mice. (C) Representative time-lapse photography images of platelet thrombus formation (green) in cremasteric arterioles of mice from each group. Scale bar = 10 μm. (D) Median integrated platelet fluorescence intensity (thrombus formation) in cremasteric arterioles after laser injury (n=3 mice/group). WT, wild-type.
PCSK9 binds to platelets. Washed platelets prepared from wild-type and ldlr-/- mice fed normal chow were incubated with increasing concentrations of biotinylated PCSK9 for 2 hours. After extensive washing, platelet-bound PCSK9 was measured. Results shown are representative of triplicate experiments.
PCSK9 enhances platelet aggregation. (A) ADP-induced platelet aggregation in PRP from mice of the indicated genotypes, all receiving CD, was studied. rPCSK9 (30 μg/mL) was added to PRP from a pcsk9-/- mouse 5 min prior to addition of ADP, as indicated. Light transmission aggregometry tracings are shown. (B) Bar graph showing mean maximal % aggregation (n=3-5 mice/group); The data were shown as mean ± SEM. *p<0.05 vs. WT; #p<0.05 vs. pcsk9-/- without added rPCSK9. (C) ADP-induced platelet aggregation in PRP from mice of the indicated genotypes, receiving CD or WD, as indicated, was studied. (D) Bar graph showing mean maximal % aggregation (n=3/group); The data were shown as mean ± SEM. *p<0.05 vs. WT receiving CD; #p<0.05 vs. WT receiving WD. ADP, adenosine diphosphate; CD, chow diet; PRP, platelet-rich plasma; WD, western diet; WT, wild-type. The bar graph shows the aggregation results expressed as maximal amplitude of aggregation (n=3-5 mice/group).
ADP signaling is attenuated in platelets from PCSK9-deficient mice. (A-D) Platelet lysates from WT mice and PCSK9-deficient mice fed normal chow were subjected to SDS-PAGE and Western blotting with anti-P2Y12, anti-P2Y1, anti-PAR1, and anti-CD42a antibodies, respectively. Densitometry analyses of 3 independent experiments; *P<0.05 vs. WT. (E) Washed platelets from WT and PCSK9-deficient mice fed normal chow diet were incubated 5 min in the presence or absence of ADP (10 μM), after which platelet lysates were prepared and subjected to Western blotting using antibodies against phosphorylated (p) and non-phosphorylated Akt. Densitometry analyses of 3 independent experiments. The ratio of the densities of the p-Akt and non-Akt bands was calculated for each experiment. Data shown are normalized to those of unstimulated platelets from WT mice, which were assigned a value of 1.0. The data were shown as mean ± SEM. *P<0.05 vs. unstimulated platelets from WT mice; **P<0.05 vs. ADP-stimulated platelets from WT mice. ADP, adenosine diphosphate; p-Akt, phospho-Akt; SDS-PAGE, sodium dodecyl sulfate polyacrylamide gel electrophoresis; WT, wild-type.
Supplemental Figure 1: PCSK9 mRNA in platelets and livers. PCSK9 mRNA was assessed by quantitative RT-PCR in platelets of the indicated genotypes, receiving CD or WD, as indicated, was studied. Data (mean ± SEM) are for 3 experiments and are expressed as fold-control. *P<0.05 vs. WT-ND. **P<0.05 vs. WT-WD.
Diet |
Genotype |
Total-C |
TG |
LDL-C |
HDL-C |
Chow |
WT |
1.48±0.07 |
0.42±0.13 |
0.30±0.01 |
1.10±0.07 |
pcsk9-/- |
0.75±0.09* |
1.15±0.22* |
0.13±0.01* |
0.56±0.08* |
|
Western |
WT |
2.76±0.21 |
0.30±0.06 |
0.72±0.10 |
1.40±0.07 |
pcsk9-/- |
2.26±0.13# |
0.19±0.04* |
0.39±0.02* |
1.48±0.11 |
Table 1. Plasma Lipid Profiles