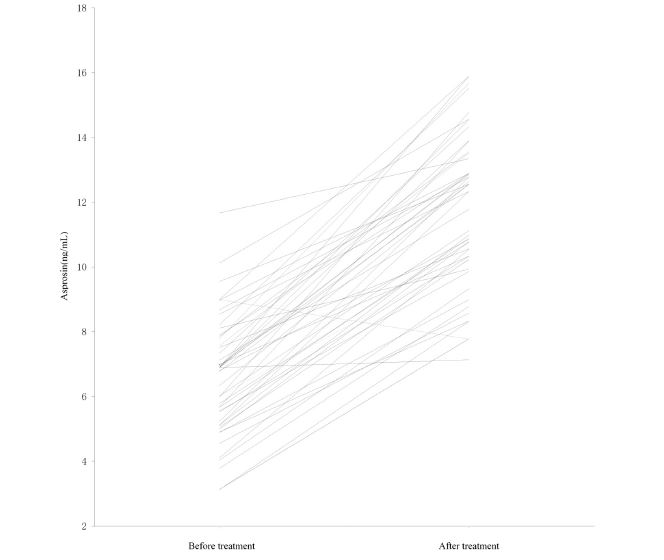
Figure 1: Serum asprosin levels in patients with OSA before and after nasal CPAP treatment
Figure 1: Serum asprosin levels in patients with OSA before and after nasal CPAP treatment
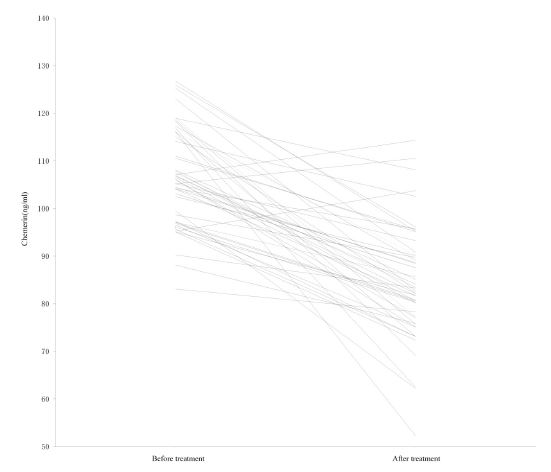
Figure 2: Serum chemerin levels in patients with OSA before and after nasal CPAP treatment
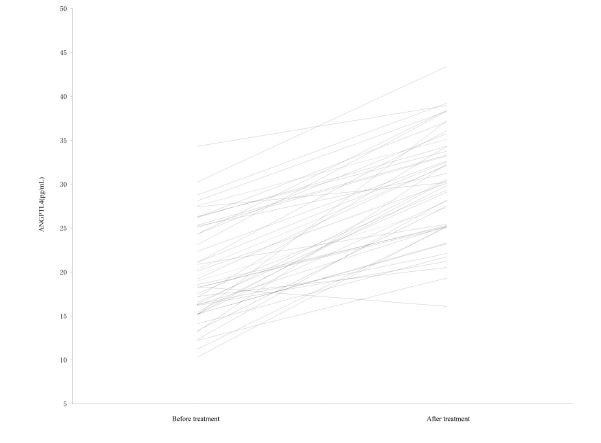
Figure 3: Serum ANGPTL4 levels in patients with OSA before and after nasal CPAP treatment
Tables at a glance
Figures at a glance