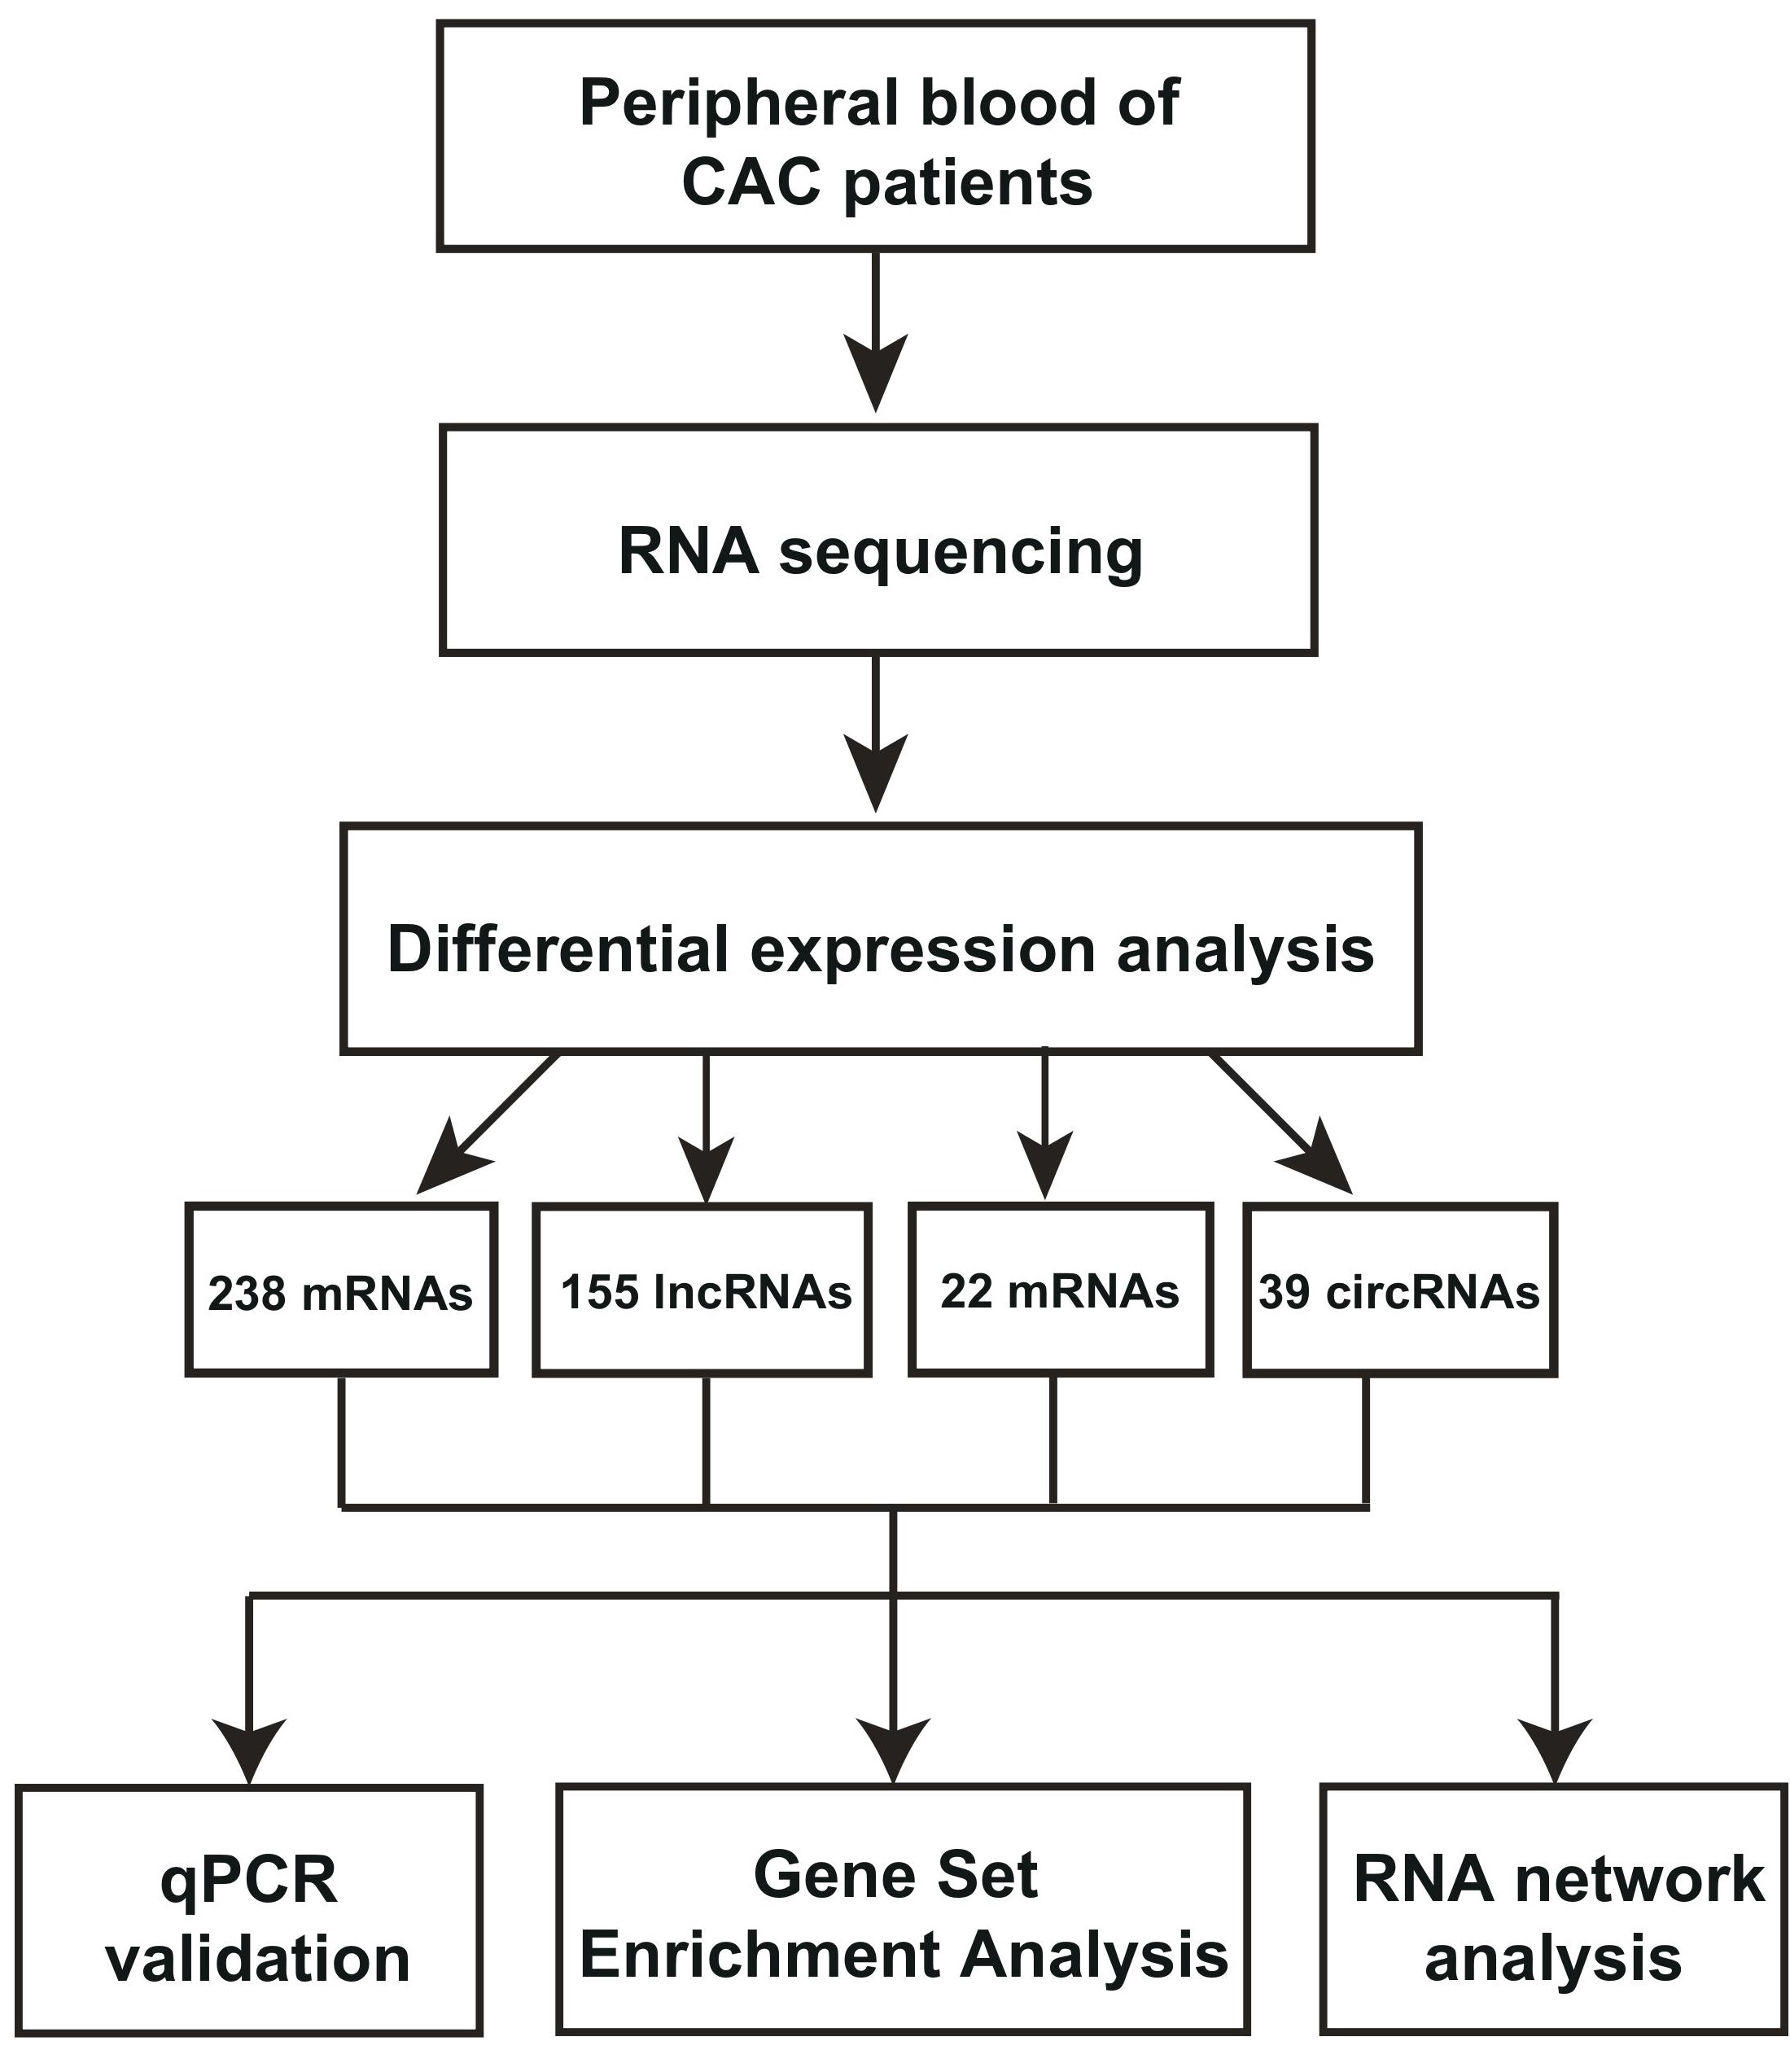
Figure : Graphical abstract
Figure : Graphical abstract
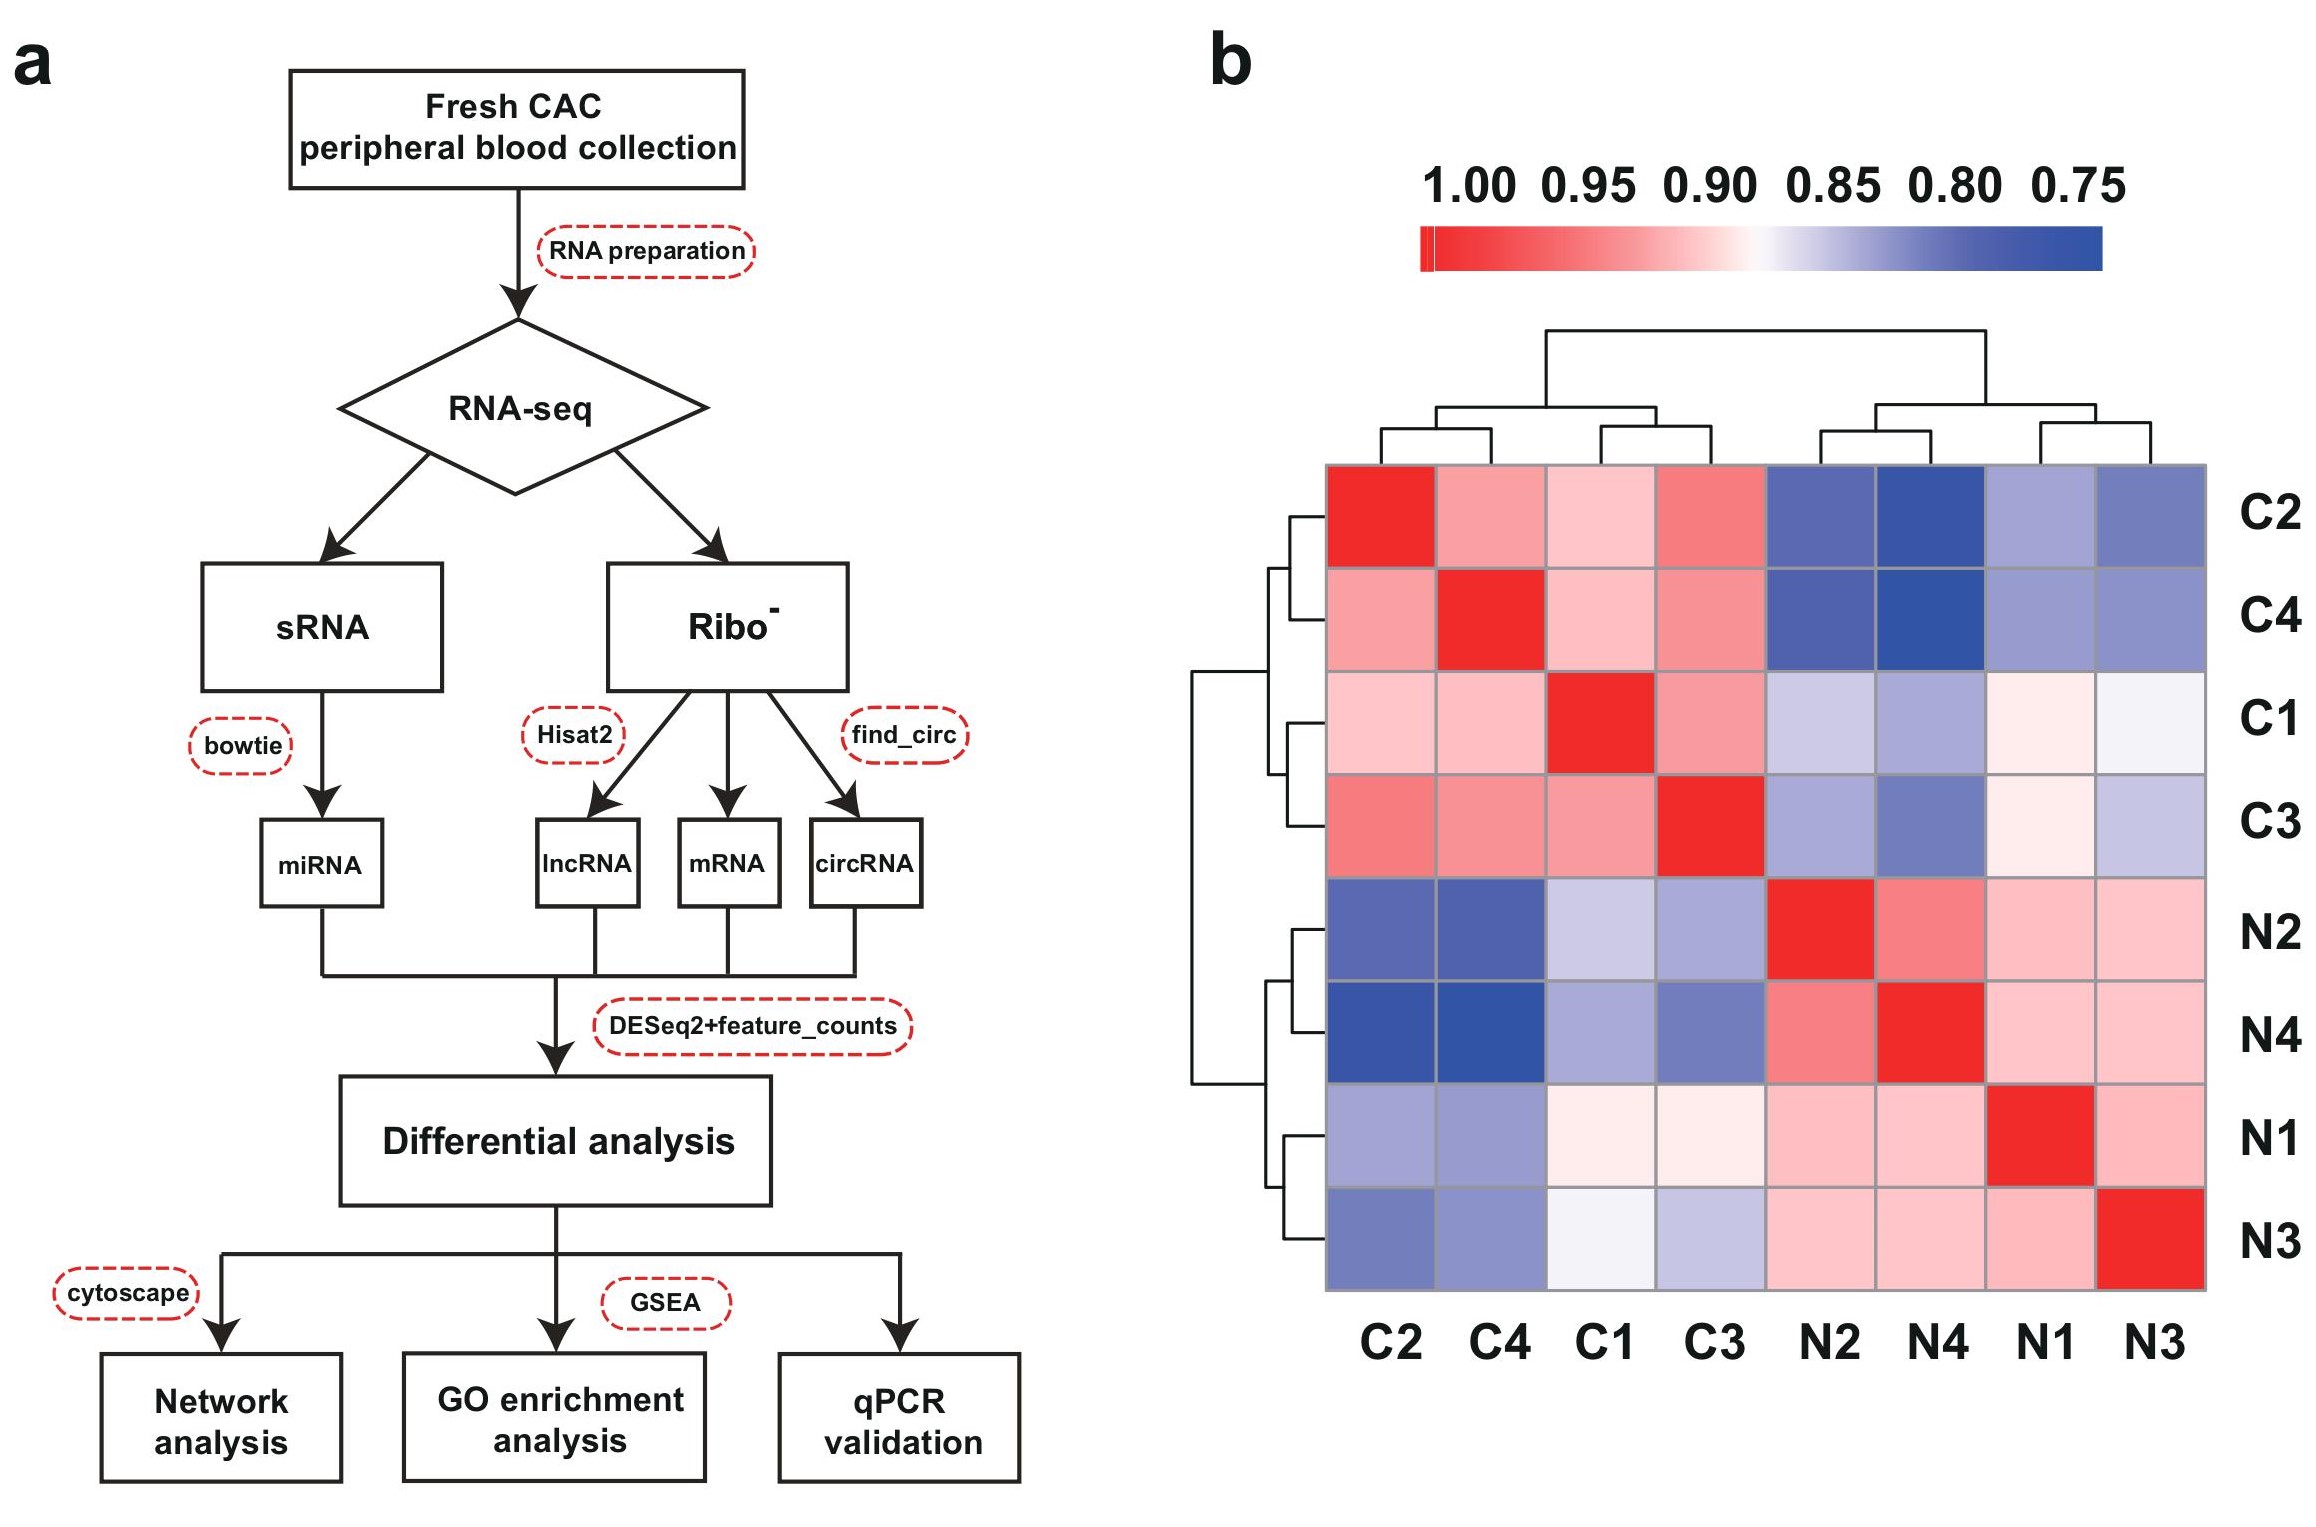
Figure 1: RNA-seq analysis of differentially expressed RNAs from peripheral blood of coronary artery calcification (CAC) patients. a, The workflow of CAC RNA-seq and in-depth investigations in this study. The bioinformatics software were also indicated. b, Heatmap of correlation between calcification (C) or normal samples (N) by Pearson’s correlation coefficient analysis
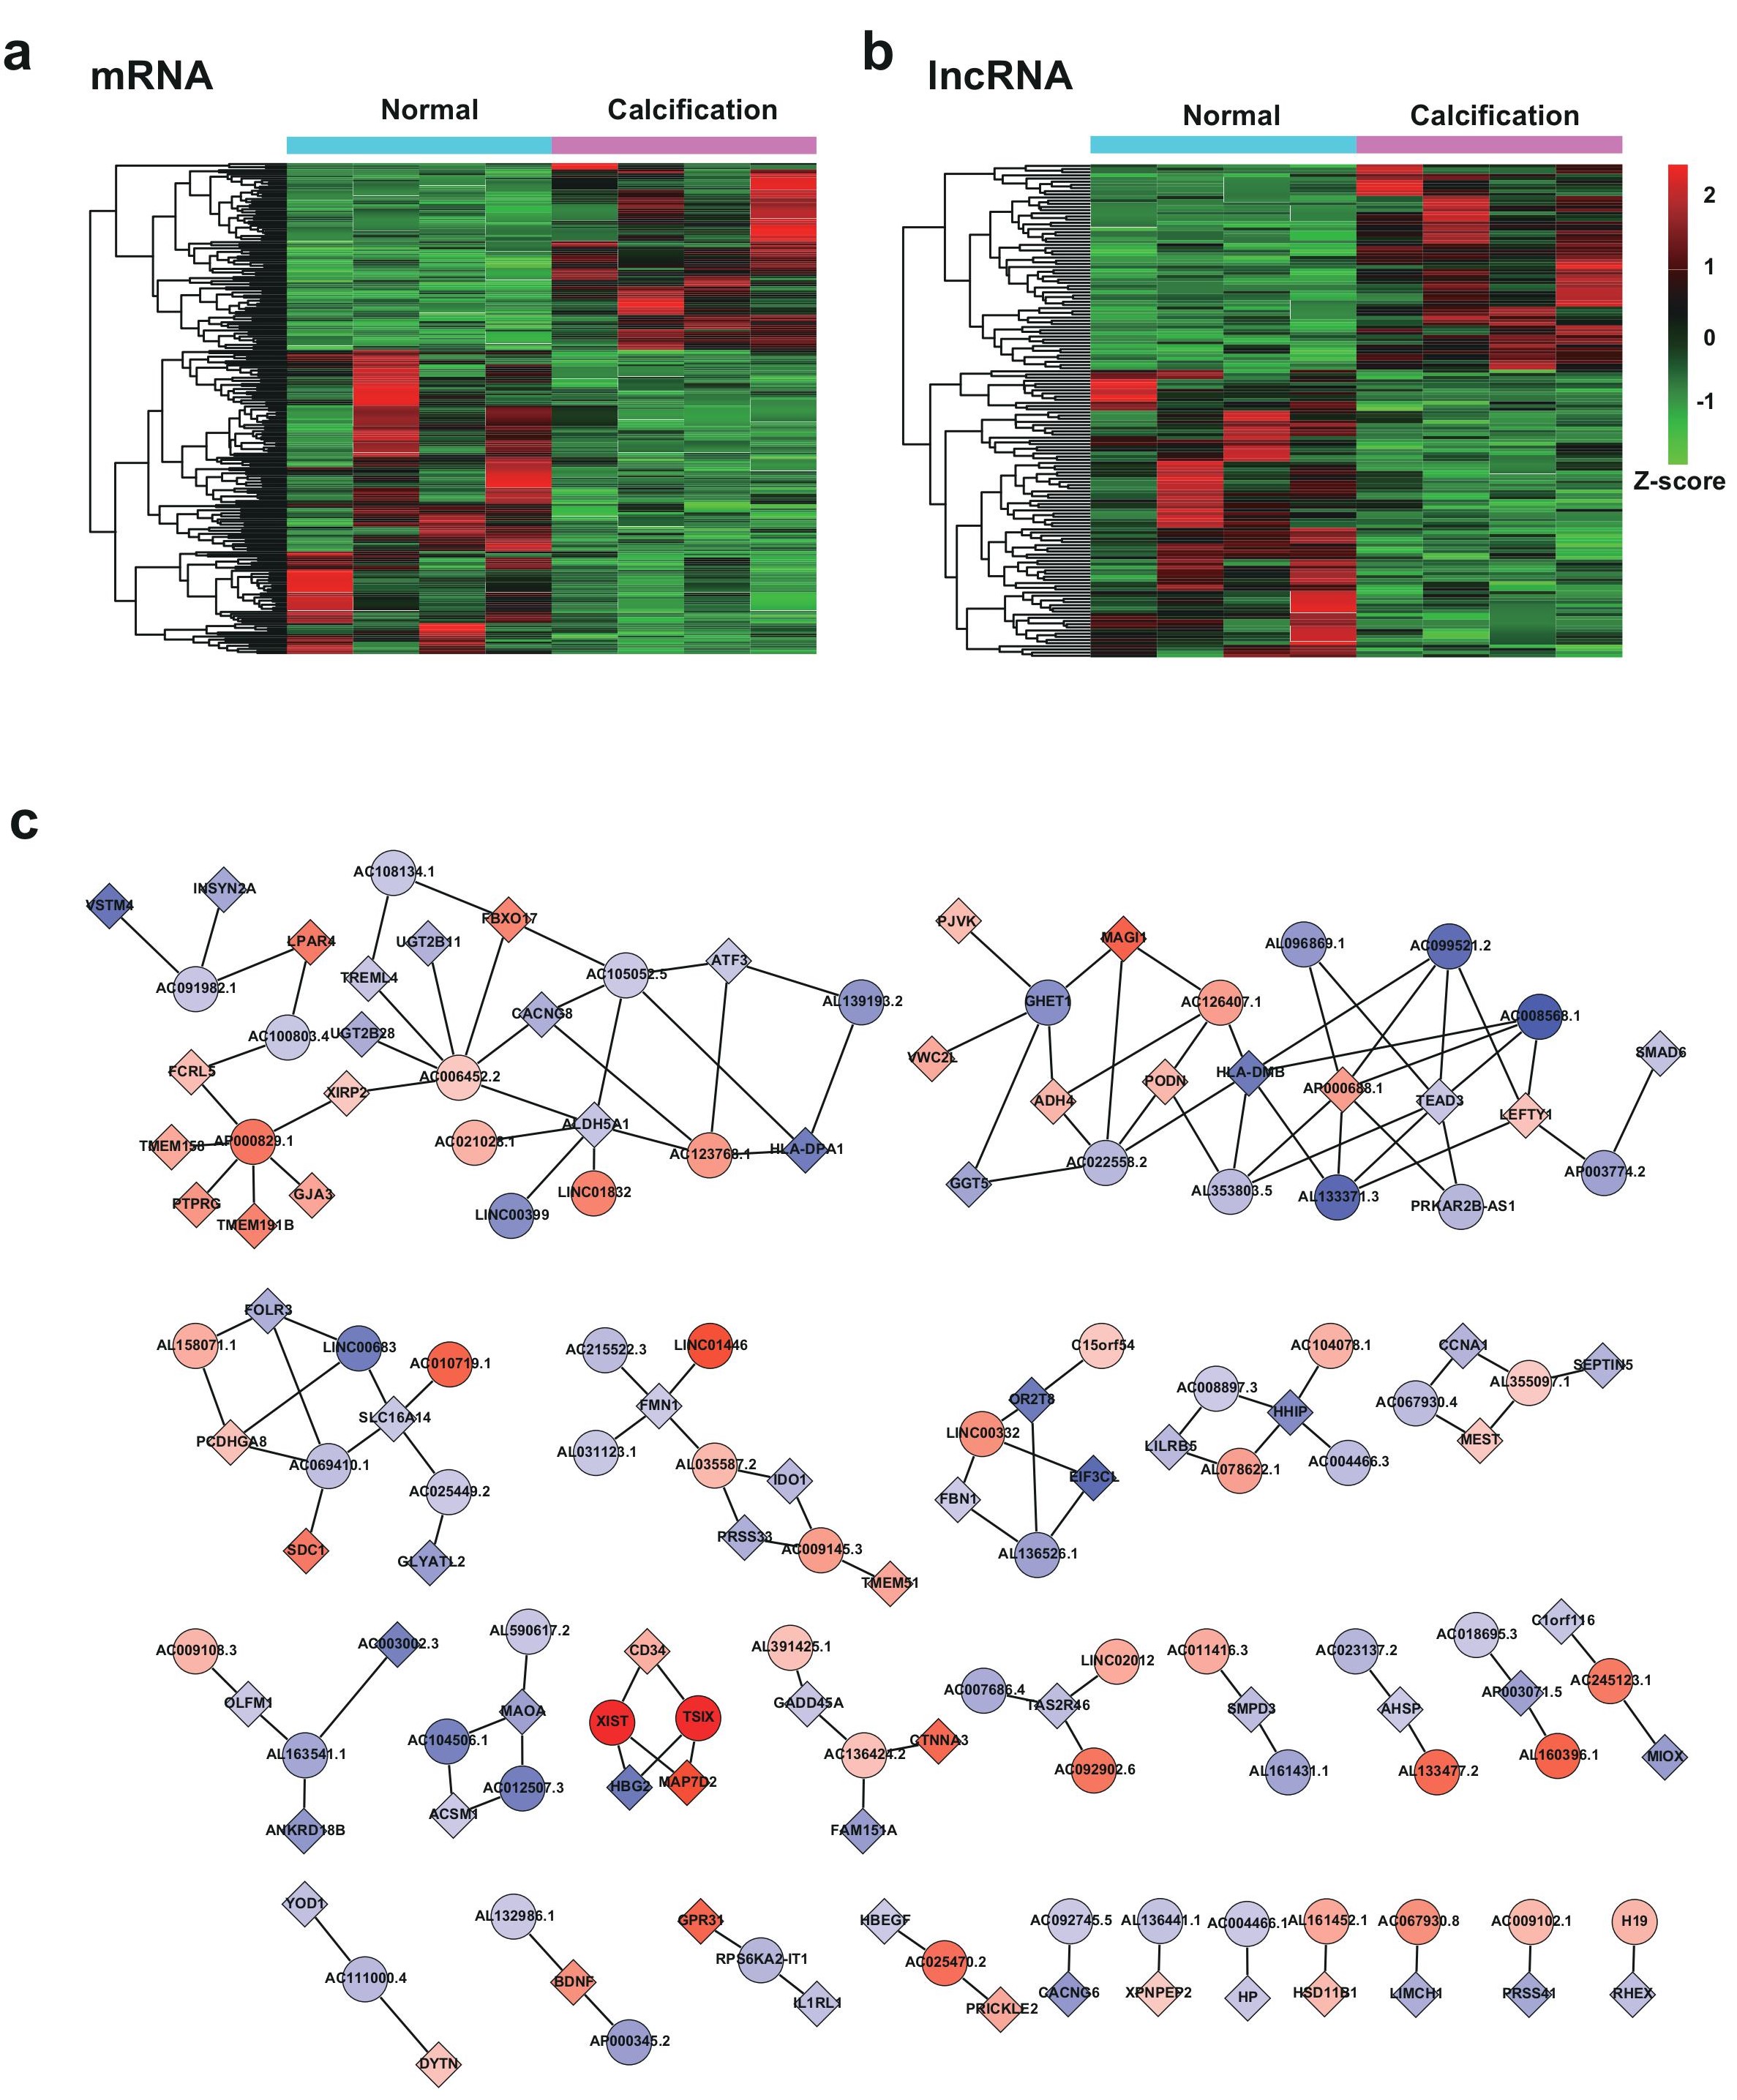
Figure 2: Bioinformatics analysis of differentially expressed mRNAs and lncRNAs in CAC. a, Hierarchical cluster heatmap of the differentially expressed mRNA in CAC. b, Hierarchical cluster heatmap of the differentially expressed lncRNAs in CAC. c, Representation of the lncRNA- mRNA co-expression network (correlation coefficient absolute value >0.99). The boxes represent mRNA, and the circles represent lncRNA. Red, upregulated; blue, downregulated
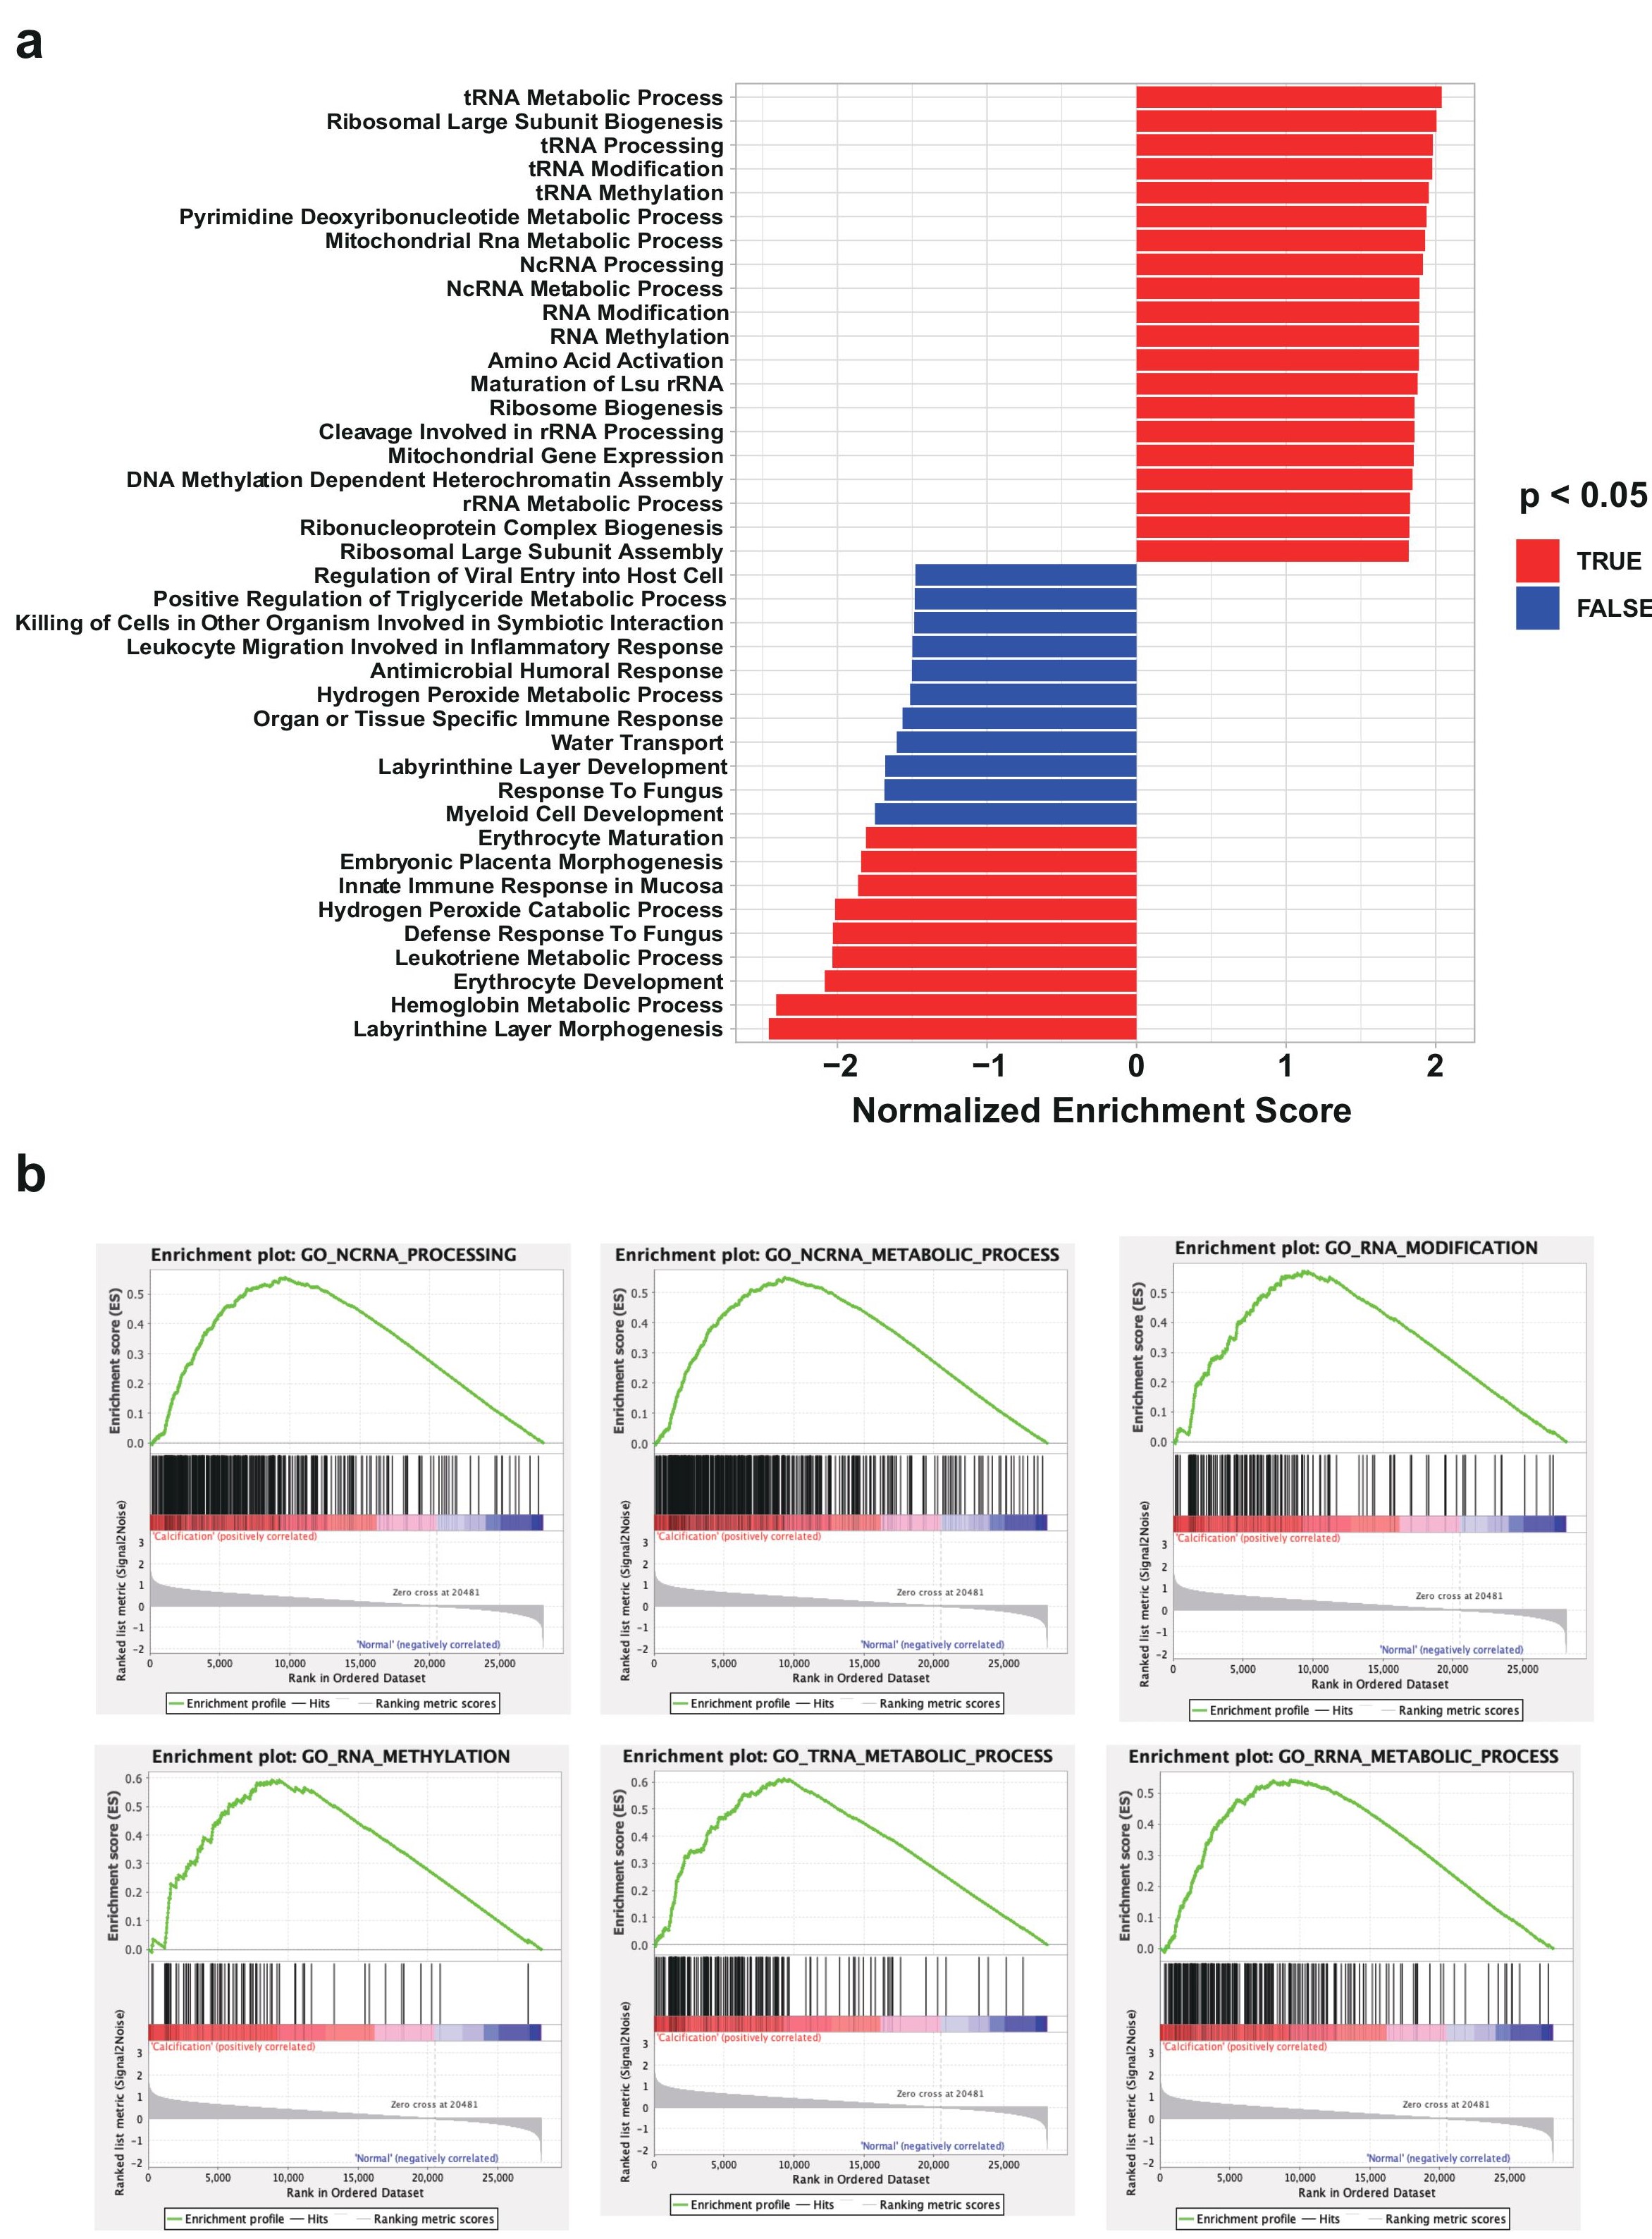
Figure 3: Gene Set Enrichment Analysis (GSEA) analysis of differentially expressed mRNAs in CAC RNA-seq. a, GSEA bar plot of the up-regulated or down-regulated gene ontology (GO) term in CAC. b, Representation of enrichment plot of the six RNA process-related GO ontology
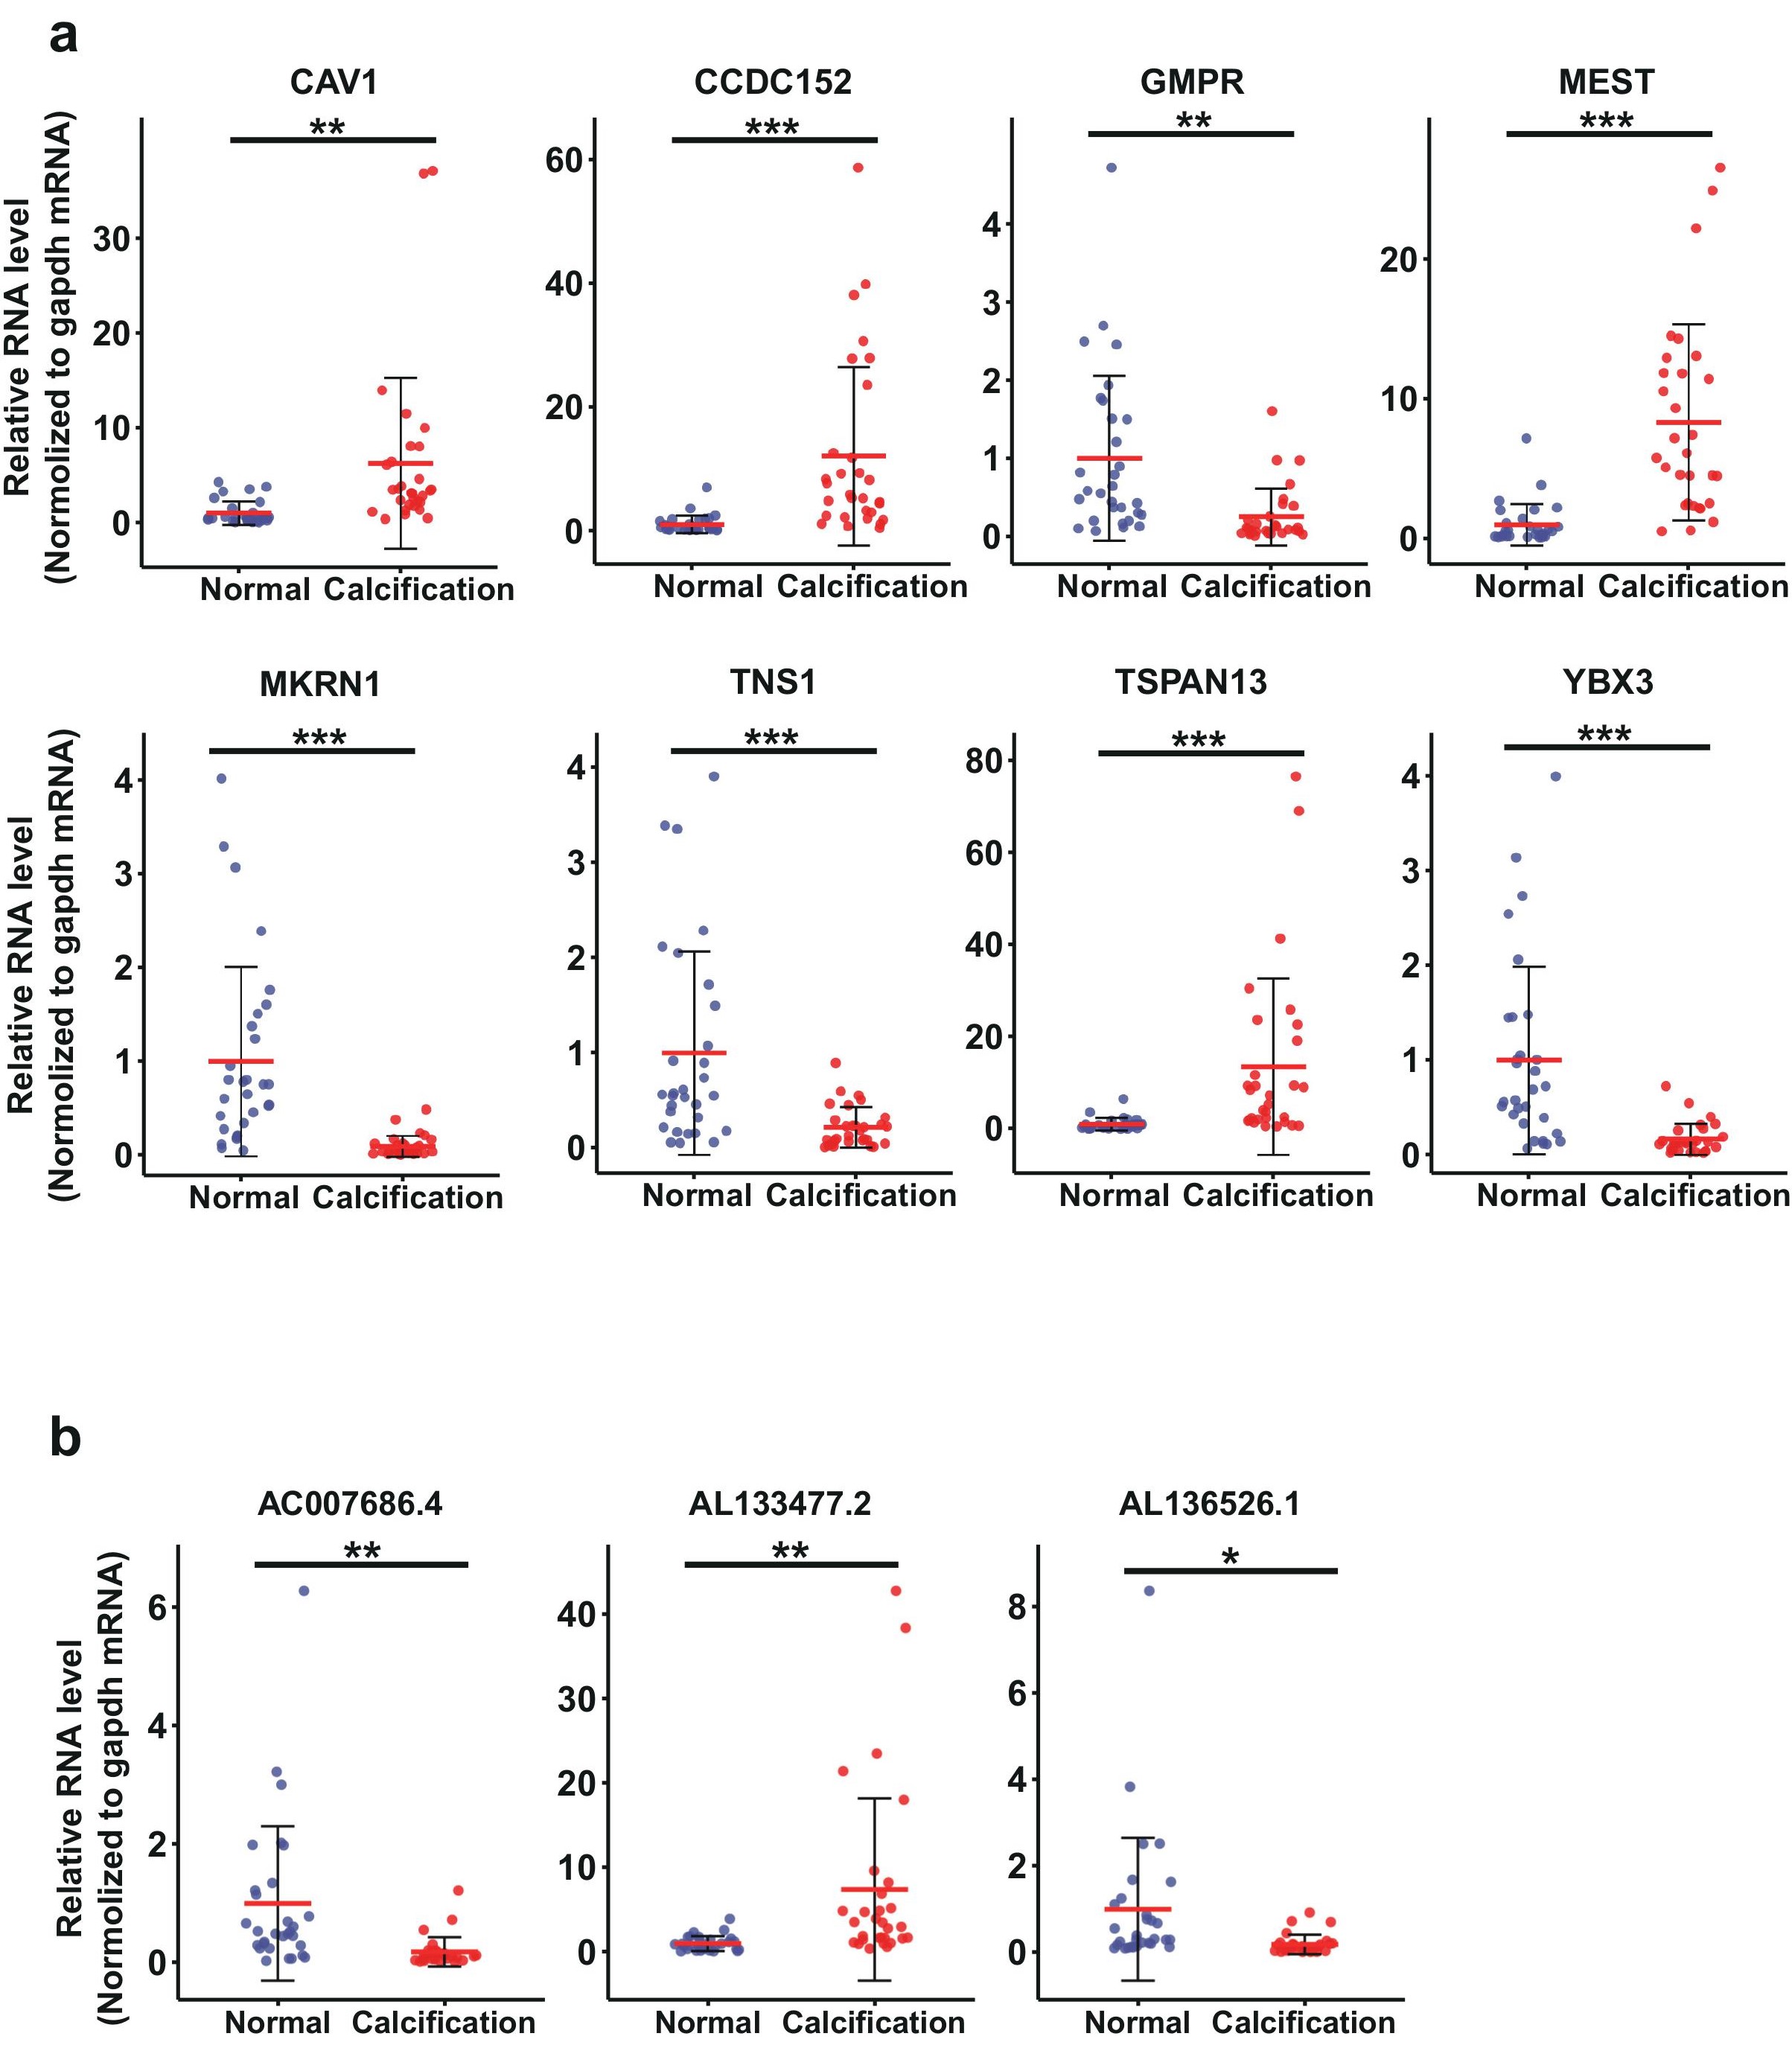
Figure 4: Validation of mRNAs and lncRNAs identified from RNA-seq by RT-qPCR in clinical CAC samples. a, The RT-qPCR validation results of 8 dysregulated mRNAs. b, The RT-qPCR validation results of 3 dysregulated lncRNAs. The patients information of the CAC samples for validation are included in the Table S3. Data are median SD. *p < 0.05, **p < 0.01, ***p < 0.001 are based on the Student’s t-test
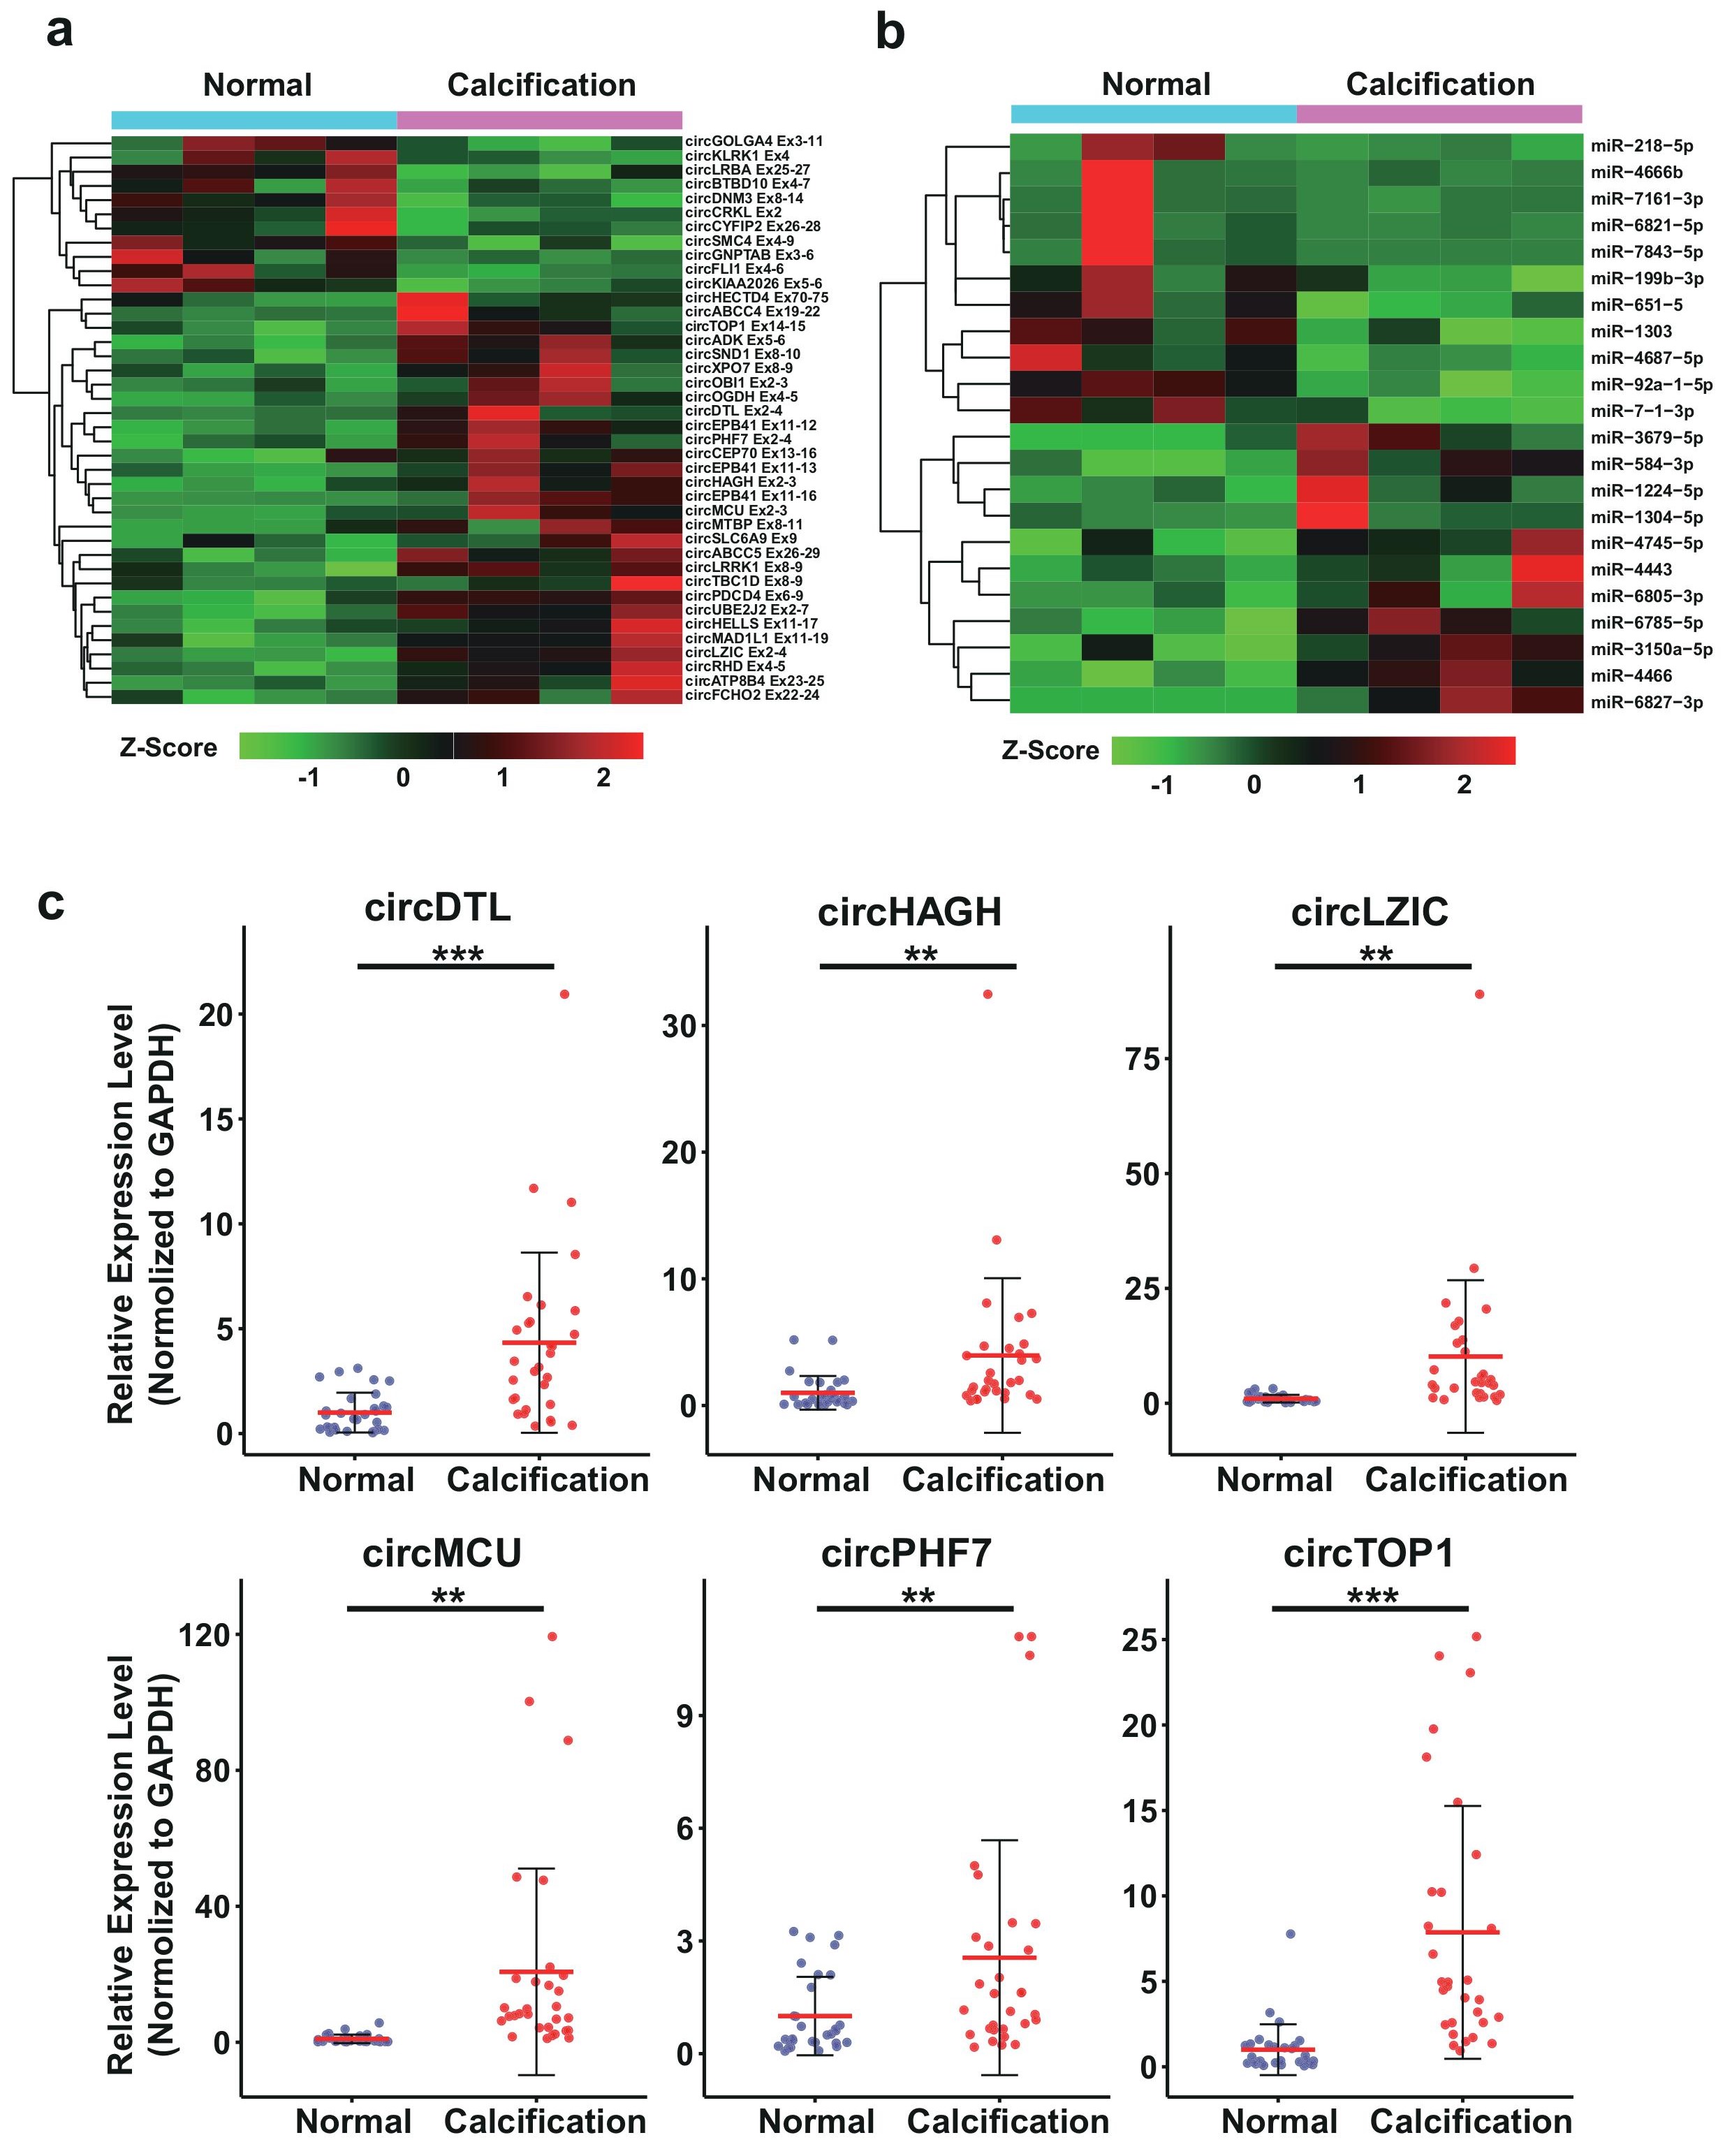
Figure 5: The bioinformatics analysis and RT-qPCR validation of the differentially expressed circRNAs and miRNAs. a, Hierarchical cluster heatmap of differentially expressed circRNA. b, Hierarchical cluster heatmap of differentially expressed miRNA. c, RT-qPCR validation of circRNAs identified from RNA-seq in clinical CAC samples. The patients information of the CAC samples for validation are included in the Table S3. Data are median SD. *p < 0.05, **p < 0.01, ***p < 0.001 are based on the Student’s t-test
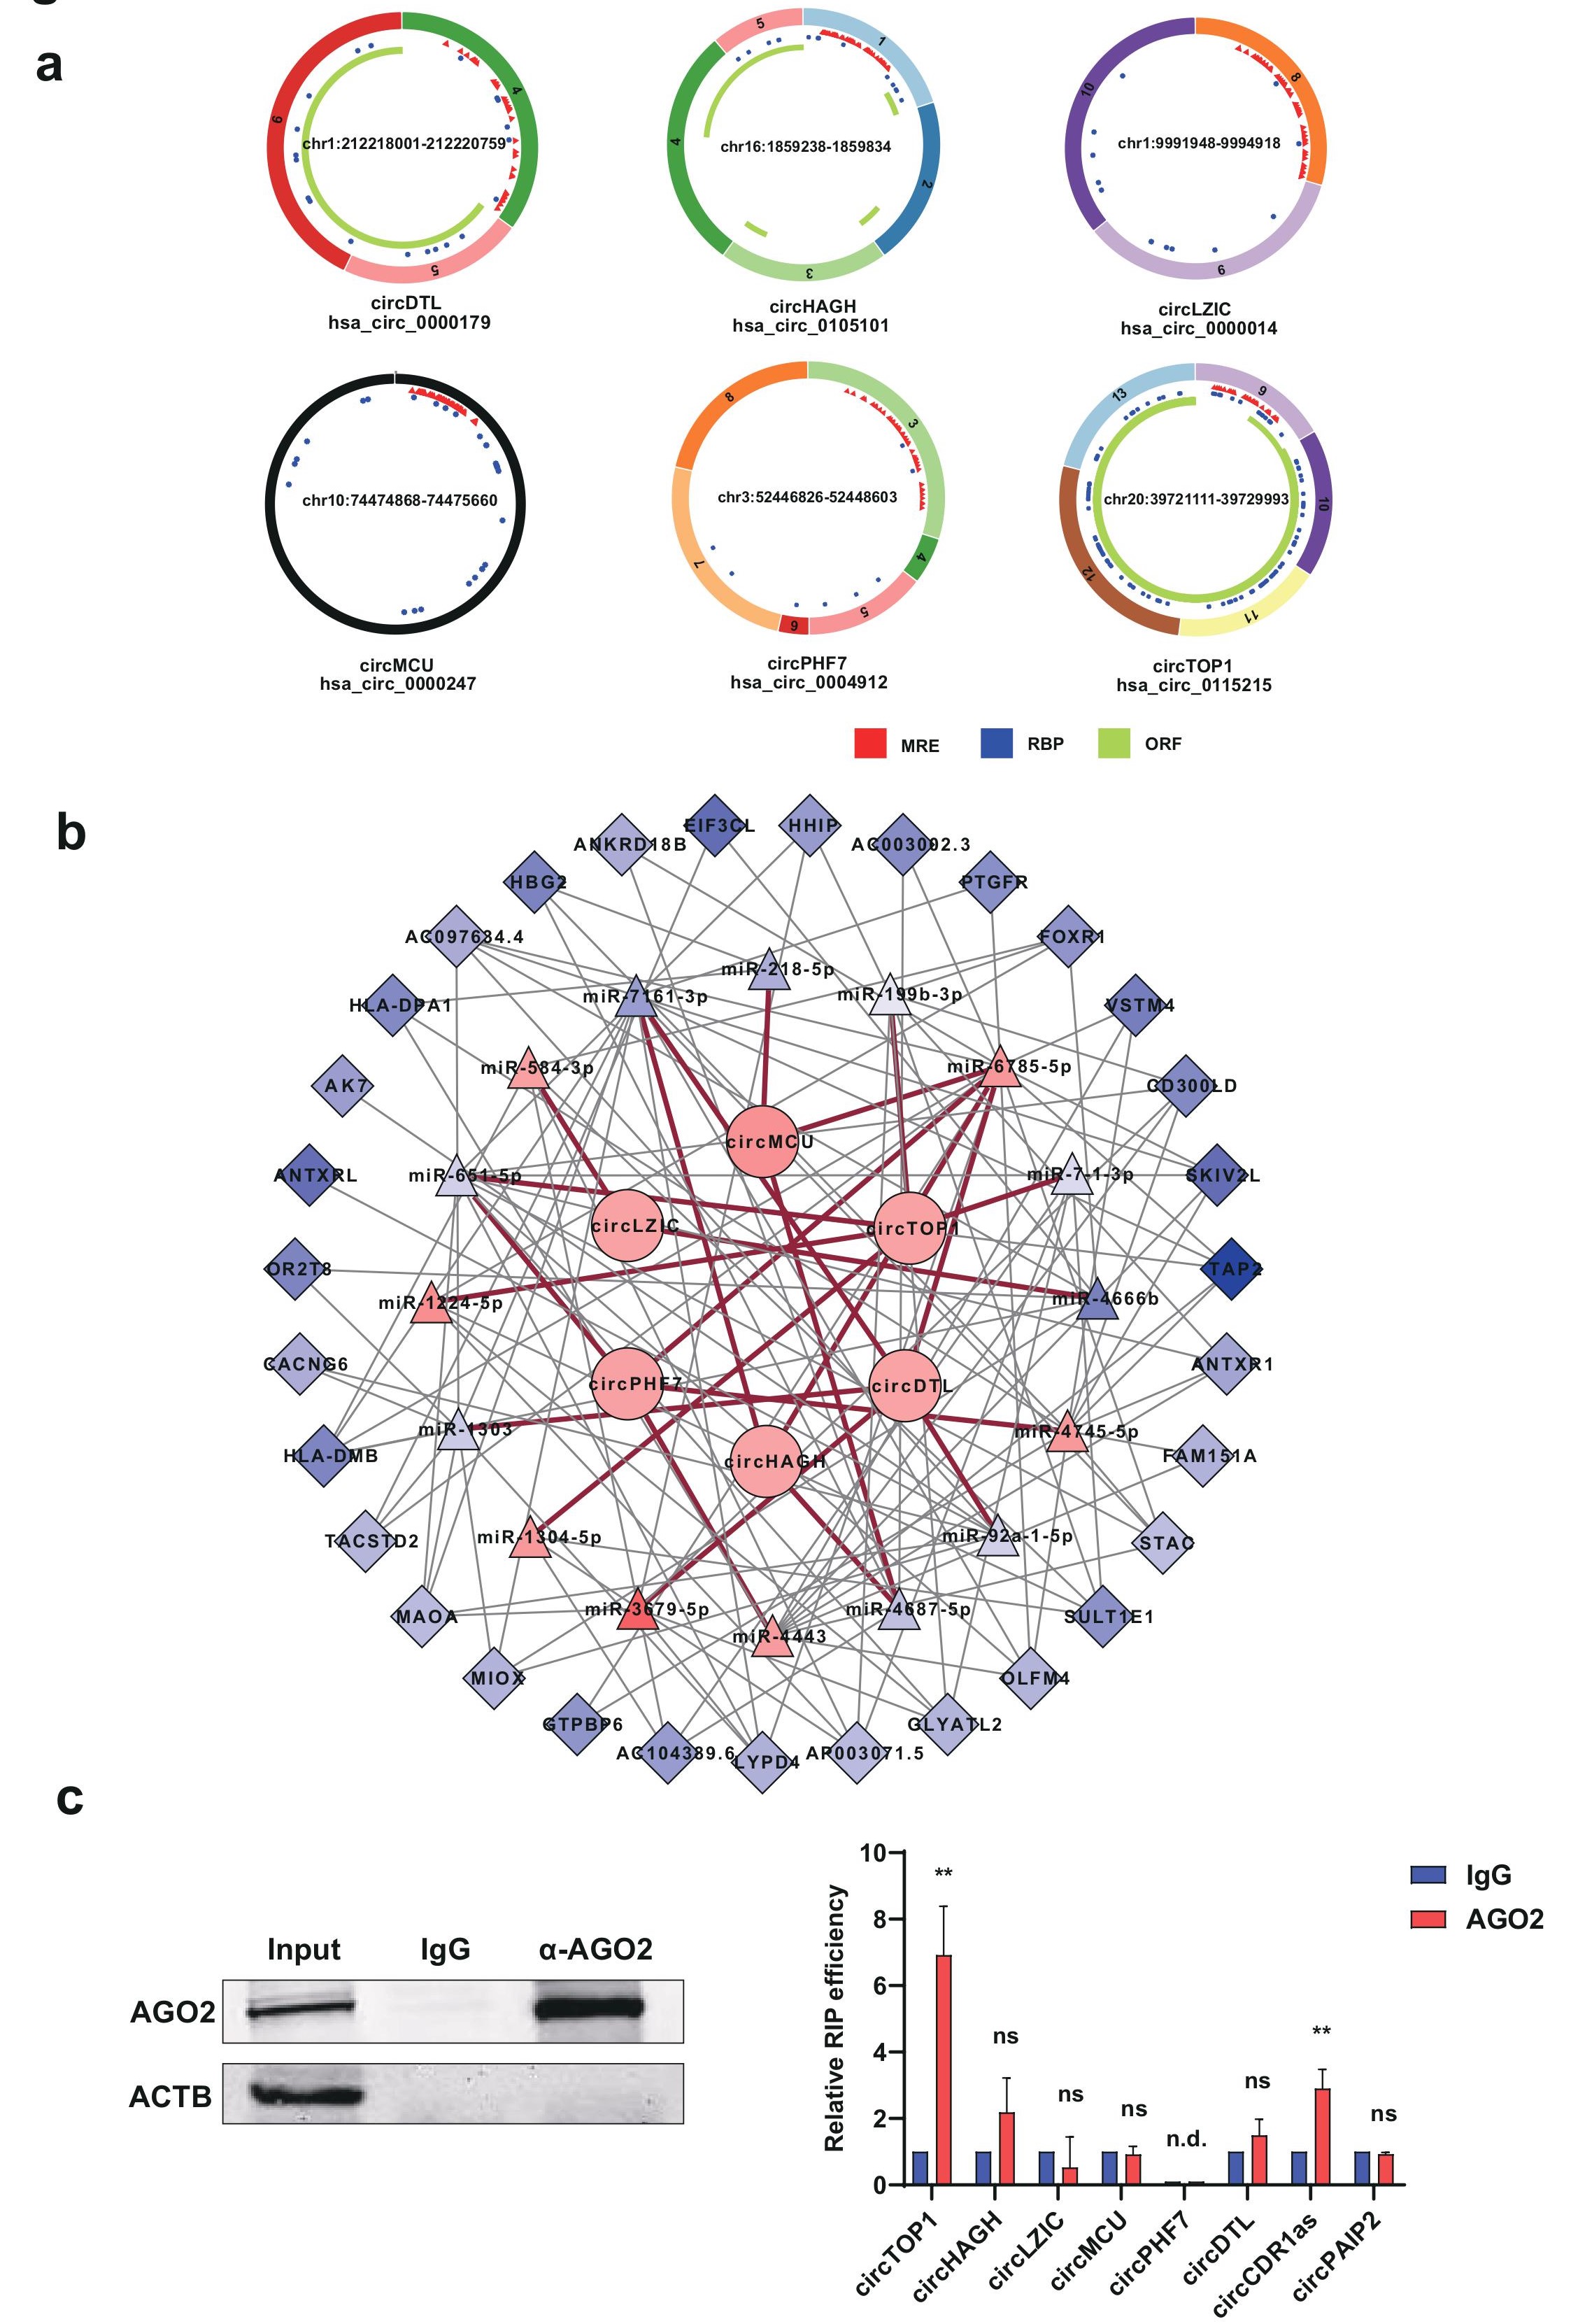
Figure 6: Construction of circRNA-miRNA-mRNA network. a, Predicted functional mechanisms of the validated six circRNAs in the RNAseq. MRE, miRNA response elements. RBP, RNA binding protein. ORF, open reading frame. b, circRNA-miRNA-mRNA interacting network for the validated circRNAs (correlation coefficient absolute value 0.99) . Boxes represent differentially expressed mRNA, triangles represent differentially expressed miRNA, circles represent differentially expressed circRNAs. Red line, circRNA-miRNA interaction; grey line mRNA- miRNA interaction. Pink, upregulated; blue, down-regulated
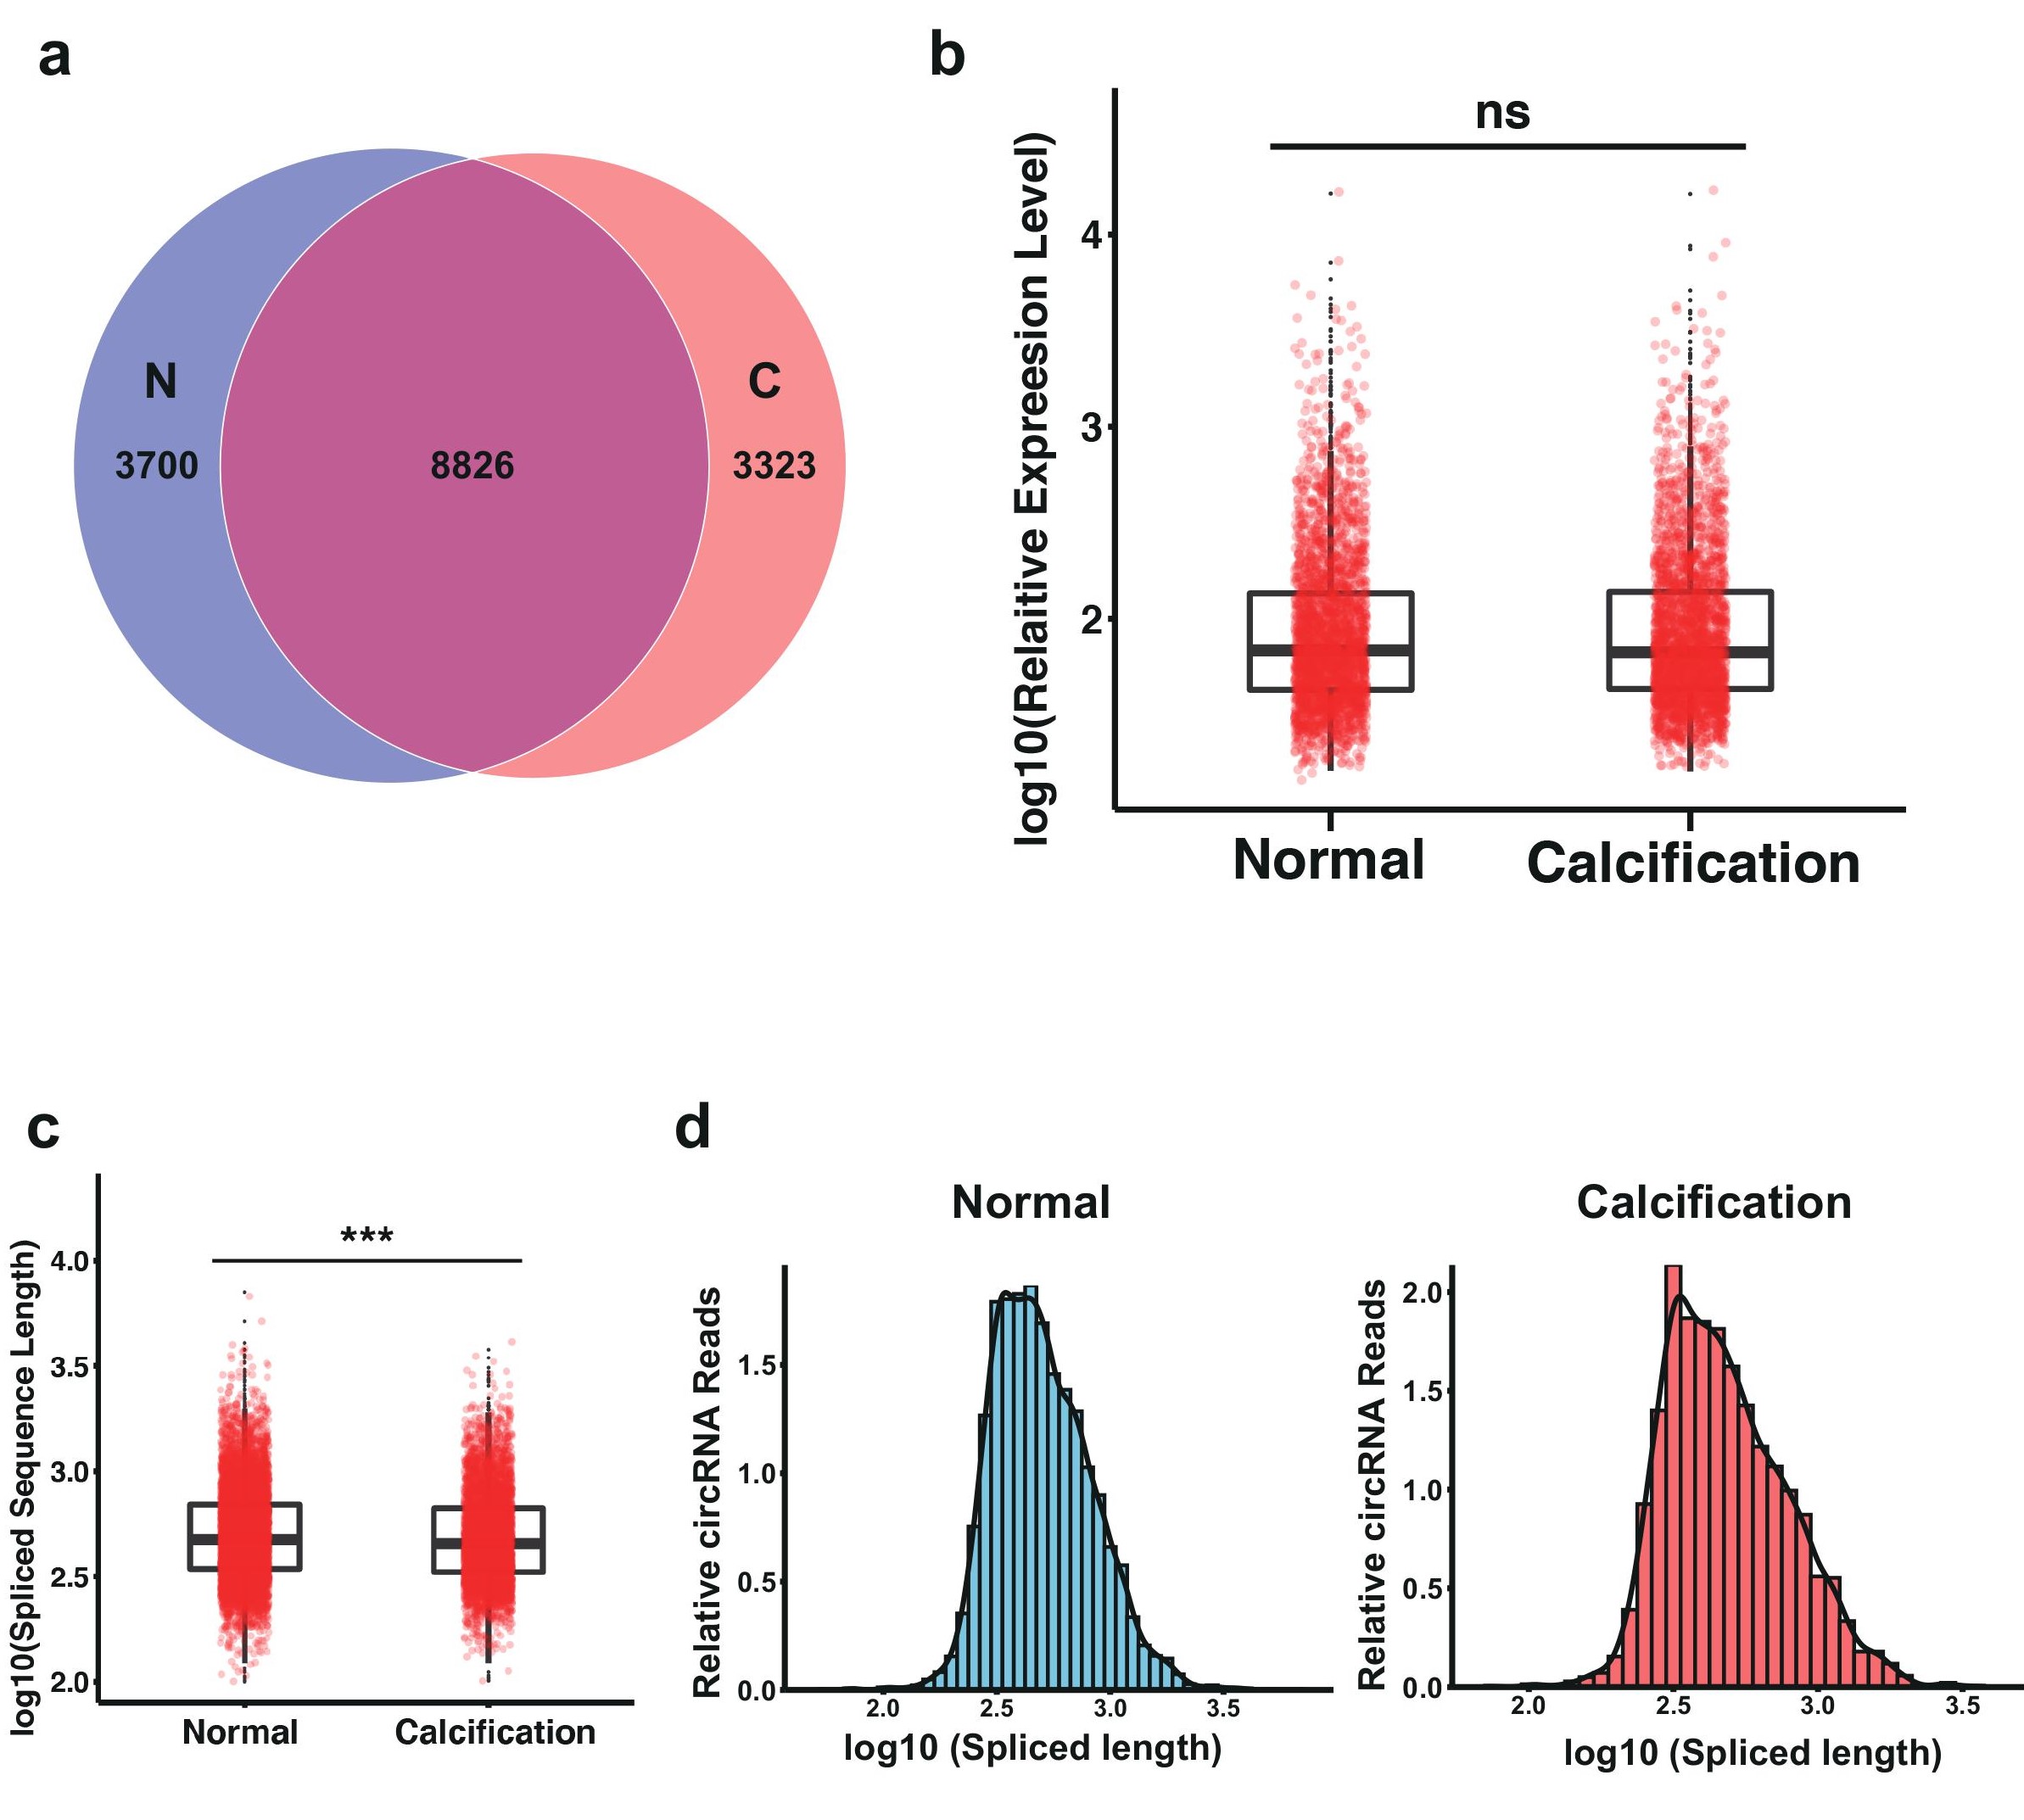
Figure S1: Expression profiling analysis for circRNAs in CAC. (A) Venn plot of the circRNAs identified in CAC and control group. C: CAC; N: normal. (B) Box plot of all circRNAs expression level in CAC and control group.(C) Box plot of all circRNAs spliced sequence length distribution in CAC and control group. (D-E) The distribution of circRNAs spliced sequence length in CAC and control group
Tables at a glance
Figures at a glance