Figure 1: Graphical abstract
Author |
Bianco |
Rocha |
Davierwala |
Nambiar |
Raja |
|||||
Acronym |
SYNTAX Extended |
|||||||||
Date |
2023 |
2022 |
2021 |
2019 |
2018 |
|||||
Follow-up |
5 years |
5 years |
11.9 years |
3years |
5 years |
|||||
|
PCI(n=838) |
MAG(n=838) |
PCI(n=1027) |
MAG(n=1027) |
PCI(n=901) |
MAG(n=310) |
PCI(n=903) |
MAG(n=940) |
PCI(n=1126) |
MAG(n=1030) |
Age (years) |
|
|
59.8(7.4) |
59.5(7.4) |
65.3(9.6) |
62.4(9.9) |
65.2(9.7) |
61.7(8.9) |
55 |
62 |
Male sex (%) |
77.8 |
83.1 |
84.8 |
85.4 |
76.5 |
85.2 |
76.4 |
64.9 |
77.6 |
87.7 |
CAD risk factors |
|
|
|
|
|
|
|
|
|
|
Diabetes (%) |
44.2 |
41.6 |
42.9 |
42.6 |
25.7 |
23.2 |
25.6 |
89.2 |
21.3 |
18.1 |
Hypertension (%) |
86.9 |
87.1 |
70.6 |
69.3 |
69.4 |
63.2 |
68.9 |
61.2 |
53.2 |
78.1 |
Dyslipidaemia (%) |
86.8 |
89.3 |
40.5 |
40.2 |
78.3 |
78.6 |
78.7 |
46.8 |
|
|
Current smokers (%) |
25.4 |
24.5 |
19.5 |
19.6 |
18.3 |
24.4 |
18.5 |
16.7 |
19.1 |
12 |
Preoperative risk factors |
|
|
|
|
|
|
|
|
|
|
Previous MI (%) |
|
|
12.7 |
12.6 |
32 |
29.2 |
31.9 |
56 |
35.4 |
43.5 |
Previous cerebrovascular disease |
16 |
16.9 |
2.4 |
2.3 |
13.4 |
16.8 |
8.2 |
2.4 |
1.8 |
3.5 |
Peripheral vascular disease (%) |
17.5 |
19.1 |
|
|
9 |
9.7 |
|
|
1.5 |
7.8 |
COPD (%) |
15.8 |
15.5 |
12.5 |
12.9 |
8.1 |
6.8 |
|
13 |
|
|
Congestive heart failure (%) |
11.6 |
8.7 |
6.4 |
5.6 |
3.9 |
2.6 |
4 |
|
|
|
Clinical presentation |
|
|
|
|
|
|
|
|
|
|
Stable angina (%) |
45.1 |
51.3 |
|
|
57 |
51.6 |
56.9 |
|
45.7 |
65.9 |
Disease type |
|
|
|
|
|
|
|
|
|
|
3-vessel disease (%) |
73.3 |
80 |
41.9 |
40.5 |
59 |
64.5 |
|
|
|
|
LMCAD (%) |
|
|
2.6 |
2.4 |
41 |
35.5 |
|
|
|
|
Author |
Thuijs |
Benedetto |
Locker |
Habib |
Moshkovitz |
|||||
Acronym |
EXCEL |
|||||||||
Date |
2018 |
2016 |
2016 |
2015 |
2012 |
|||||
Follow-up |
3years |
3.1years |
7.9 years |
9years |
5years |
|||||
|
PCI(n=948) |
MAG(n=217) |
PCI(n=483) |
MAG(n=483) |
PCI(n=872) |
MAG(n=872) |
PCI(n=546) |
MAG(n=546) |
PCI(n=271) |
MAG(n=226) |
Age (years) |
66.0(9.6) |
64.5(9.3) |
66(12) |
65(9) |
66.8(11.6) |
62.4(9.9) |
60.1(12.8) |
60.7(8.1) |
|
|
Male sex (%) |
76.2 |
85.7 |
75.6 |
79.9 |
26.4 |
85.2 |
77.3 |
75.6 |
73.4 |
85.8 |
CAD risk factors |
|
|
|
|
|
|
|
|
|
|
Diabetes (%) |
30.2 |
33 |
19 |
16.8 |
32.6 |
34.9 |
38.5 |
37 |
100 |
100 |
Hypertension (%) |
74.5 |
67.3 |
68.7 |
69.6 |
80.7 |
83 |
59.5 |
9.5 |
68.6 |
78.3 |
Dyslipidaemia (%) |
71.5 |
67.7 |
|
|
|
|
|
|
75.6 |
70.4 |
Current smokers (%) |
24.1 |
62 |
20.7 |
18.2 |
|
|
|
|
|
|
Preoperative risk factors |
|
|
|
|
|
|
|
|
|
|
Previous MI (%) |
18.1 |
11.5 |
33.5 |
32.5 |
27.3 |
27.1 |
34.6 |
33.7 |
21.8 |
33.6 |
Previous cerebrovascular disease (%) |
5.5 |
4.6 |
2.9 |
2.3 |
8.4 |
8.2 |
|
|
|
|
Peripheral vascular disease (%) |
10.3 |
|
11.2 |
9.1 |
12.5 |
12 |
|
|
5.2 |
11.9 |
COPD (%) |
6.9 |
6 |
|
|
10.8 |
10.5 |
6 |
8.4 |
3.7 |
3.5 |
Congestive heart failure (%) |
7.1 |
5.1 |
26.5 |
25.7 |
9.7 |
9.9 |
5.5 |
5.5 |
9.6 |
12.4 |
Clinical presentation |
|
|
|
|
|
|
|
|
|
|
Stable angina (%) |
53.1 |
|
|
|
|
|
|
|
|
|
Disease type |
|
|||||||||
3-vessel disease (%) |
|
|
24.6 |
24.6 |
57.8 |
61.2 |
83.3 |
84.1 |
57.6 |
21.2 |
LMCAD (%) |
100 |
100 |
15.1 |
17.2 |
5.6 |
6.5 |
29.3 |
8.2 |
4.1 |
27 |
Author |
Herz |
Herz |
Locker |
|||||||
Acronym |
|
|
|
|||||||
Date |
2006 |
2005 |
2004 |
|||||||
Follow-up |
1year |
3years |
6.5years |
|||||||
|
PCI(n=87) |
MAG(n=87) |
PCI(n=113) |
MAG(n=113) |
PCI(n=363) |
MAG(n=439) |
||||
Age (years) |
|
|
60.0(10) |
60.1(10) |
|
|
||||
Male sex (%) |
93.1 |
93.1 |
95.6 |
95.6 |
73 |
71 |
||||
CAD risk factors |
|
|
|
|
|
|
||||
Diabetes (%) |
44.8 |
|
36.3 |
32.7 |
100 |
100 |
||||
Hypertension (%) |
64.4 |
|
61.1 |
59.3 |
49 |
57 |
||||
Dyslipidaemia (%) |
70.1 |
|
72.6 |
70.8 |
|
|
||||
Current smokers (%) |
|
|
|
|
|
|
||||
Preoperative risk factors |
|
|
|
|
|
|
||||
Previous MI (%) |
32.2 |
|
38.9 |
35.4 |
37 |
39 |
||||
Previous cerebrovascular disease (%) |
|
|
|
|
|
|
||||
Peripheral vascular disease (%) |
5.7 |
|
8.3 |
6.7 |
10 |
9.8 |
||||
COPD (%) |
4.6 |
|
4.4 |
2.7 |
3 |
8.4 |
||||
Congestive heart failure (%) |
6.9 |
|
6.2 |
6.2 |
|
|
||||
Clinical presentation |
|
|
|
|
|
|
||||
Stable angina (%) |
|
|
|
|
|
|
||||
Disease type |
|
|
|
|
|
|
||||
3-vessel disease (%) |
51.7 |
51.7 |
54 |
54 |
27 |
87 |
||||
LMCAD (%) |
3.5 |
29.1 |
3.5 |
26.5 |
3.3 |
28 |
||||
- : CAD=coronary artery disease; COPD=chronic obstructive pulmonary diseases; LMCD=left main coronary artery disease: MAG=multiple ar- terial bypass graft surgery; MI=myocardial infarction; PCI=percutaneous coronary intervention.
Table S1 : The characteristics of the study included
|
|
CABG |
PCI |
RR |
95%CI |
p |
2 |
MA-CABG vs F-DES |
|||||||
MACCE |
339 |
384 |
0.40 |
0.30-0.54 |
<0.0001 |
0 |
|
All cause death |
2835 |
2489 |
0.27 |
0.11-0.63 |
0.02 |
90 |
|
MI |
1579 |
1466 |
0.20 |
0.04-1.03 |
0.05 |
75 |
|
Repeat revascularization |
1805 |
1737 |
0.17 |
0.05-0.60 |
0.006 |
95 |
|
MA-CABG vs S-DES |
|||||||
MACCE |
1244 |
1975 |
0.41 |
0.26-0.63 |
<0.0001 |
66 |
|
All cause death |
2274 |
3101 |
0.39 |
0.23-0.68 |
0.0009 |
69 |
|
MI |
1244 |
1975 |
0.43 |
0.11-1.68 |
0.22 |
92 |
|
Repeat revascularization |
1244 |
1975 |
0.16 |
0.12-0.22 |
<0.0001 |
28 |
|
BITA-CABG vs PCI |
|||||||
MACCE |
556 |
1332 |
0.45 |
0.35-0.57 |
<0.0001 |
0 |
|
All cause death |
2022 |
2685 |
0.26 |
0.09-0.72 |
0.009 |
89 |
|
Stroke |
1270 |
1964 |
0.19 |
0.08-0.47 |
0.0004 |
16 |
|
MI |
1796 |
2414 |
0.30 |
0.06-1.49 |
0.14 |
88 |
|
Repeat revascularization |
2022 |
2685 |
0.15 |
0.05-0.47 |
0.001 |
94 |
|
- : MA-CABG= multiple arterial coronary artery bypass graft; F-DES=first-generation drug-eluting stent; S-DES=second-generation drug-elut- ing stent; MACCE=major adverse cardiac and cerebrovascular events; MI= myocardial infarction; BITA= bilateral internal thoracic arterial; PCI= percutaneous coronary intervention..
Table 1 : Subgroup analysis
Figure 1: Graphical abstract
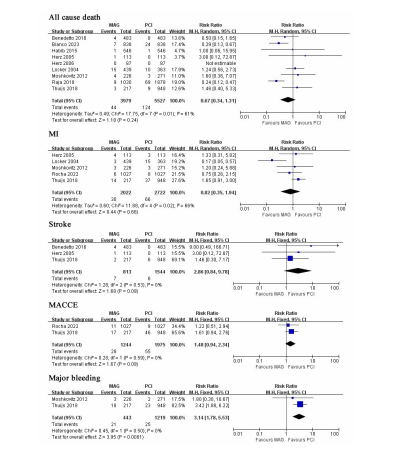
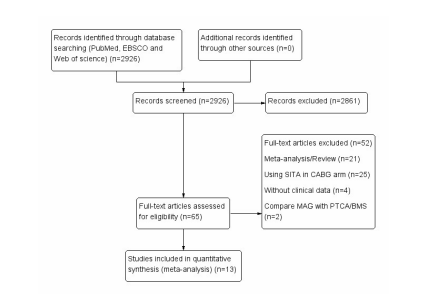
Figure 2: Flowchart of study selection
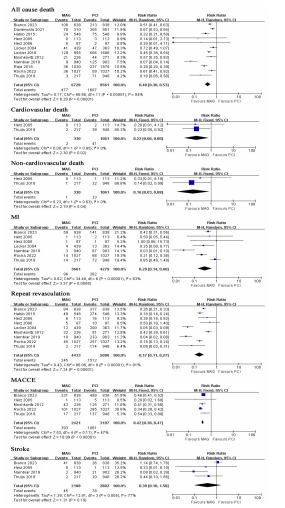
Figure 3: MAG vs. DES-PCI with short-term follow up
Forest plot for short-term incidence of MACCE, all cause death, stroke, MI, repeat revascularization and major bleeding. Risk ratio for individual studies (squares) and meta-analysis (diamonds) and 95% CI (horizontal lines) are presented.
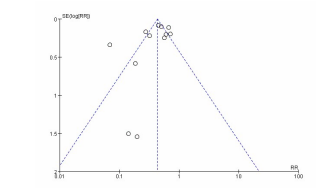
Figure 3: MAG vs. DES-PCI with long-term follow up
Forest plot for long-term incidence of MACCE, all cause death, stroke, MI and repeat revascularization. Risk ratio for individual studies (squares) and meta-analysis (diamonds) and 95% CI (horizontal lines) are presented.
Figure 4: The funnel plot for incidence of all cause death with long-term follow up
Tables at a glance
Figures at a glance