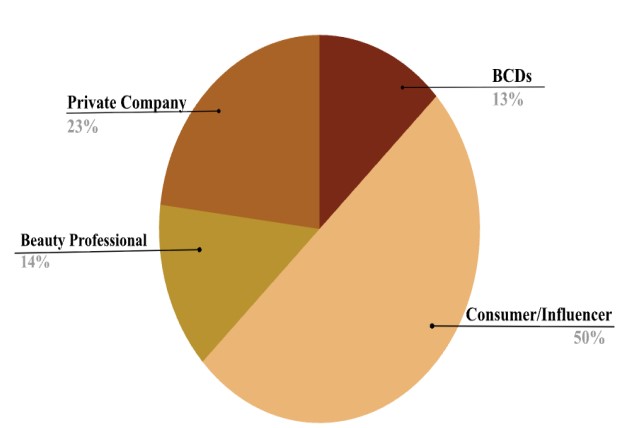
Figure 1: Percentage distribution of Striae Distensae-related TikTok videos by creator type.
Figure 1: Percentage distribution of Striae Distensae-related TikTok videos by creator type.
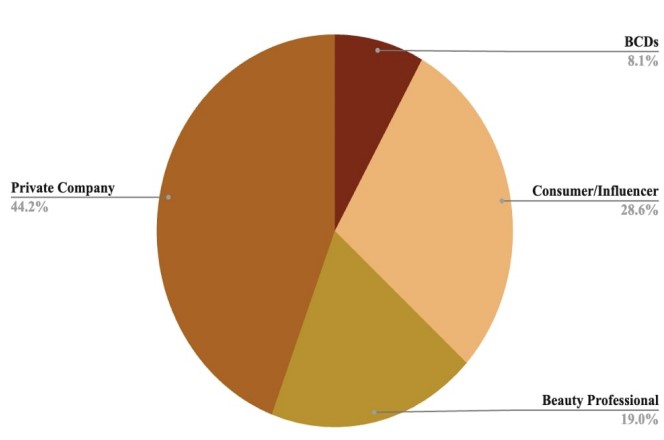
Figure 2: Percentage distribution of total views for SD TikTok content by creator type.
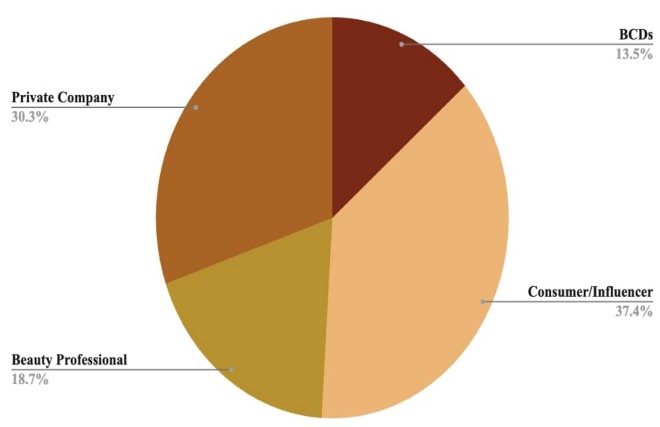
Figure 3: Percentage distribution of likes of SD TikTok content by creator type.
Tables at a glance
Figures at a glance