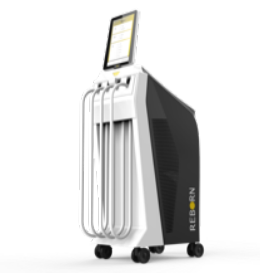
Figure 1: Lightfective ReBorn Non-Invasive Fat Reduction System
Figure 1: Lightfective ReBorn Non-Invasive Fat Reduction System
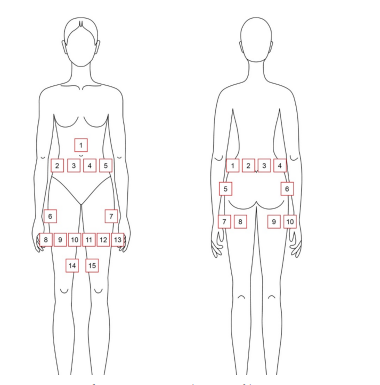
Figure 2: Applicator positioning: a) anterior; b) posterior
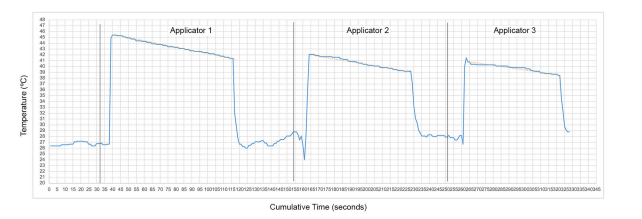
Figure 3: Example of temperature decrease from time of applicator removal to time of final temperature measurement in the treatment areas on a single patient (Patient 12)
Tables at a glance
Figures at a glance