Effects of COVID-19 Pandemic on the Spatiotemporal Trip Pattern: A Case Study from New York City with Taxi Data
Received Date: January 18, 2024 Accepted Date: February 18, 2024 Published Date: February 21, 2024
doi: 10.17303/jdmt.2024.1.101
Citation: Yixuan Wu (2024) Effects of COVID-19 Pandemic on the Spatiotemporal Trip Pattern: A Case Study from New York City with Taxi Data. J Data Sci Mod Tech 1: 1-15.
Abstract
At various stages of the pandemic, finding the impact of COVID-19 on human travel behavior in the city is critical for determining mobility patterns and developing suitable policies. Large-scale New York City taxi data is utilized to characterize urban mobility patterns in this paper, which includes a historical record of 124 million taxi medallion rides over approximately three years (Jan. 2019–Aug. 2021). To measure the correlation between different COVID-19 stages (e.g., pre-COVID-19, COVID-19 outbreak, COVID-19 recovery) and trip patterns, two quantitative indices are introduced. The spatiotemporal distribution of trip demand, such as the origin, destination, and origin-destination (OD) pairs, is considerably affected, according to preliminary findings. Further, important considerations toward the number of confirmed cases and death toll are discussed to explore the correlation between trip patterns (e.g., trip distance, trip duration, and group travel) and COVID-19, which might help to percept the changes in trip behavior and develop effective management policies during and after the pandemic.
Keywords: COVID-19; Human Mobility; Spatiotemporal Trip Pattern; Group Travel; Taxi Trip
Introduction
The World Health Organization (WHO) has classified COVID-19 as a global pandemic due to its rapid spread around the world [1]. Since the outbreak of the global pandemic, transportation, and other industries have been hard hit, affecting people’s daily travel behavior and mobility patterns. WHO issued basic hygiene guidelines to limit the spread of COVID-19, such as wearing masks, avoiding crowded places, and frequently washing hands, to reduce the virus’s influence. Furthermore, the most effective strategy is to maintain a safe social distance and take fewer outdoor trips, particularly to avoid contact with the infected person. Road transport and public transportation are improved in this situation when compared to the normal transport situation [2]. With the pandemic outbreak, changes in urban traffic can be further classified into three phases: pre-COVID-19, COVID-19 outbreak, and COVID-19 recovery. Perceptions of the spatiotemporal characteristics of urban traffic at various stages aid in understanding the impact of COVID-19 on travel behavior and developing relevant policies for traffic service and epidemic prevention.
In general, studies of residents’ travel behavior analysis are primarily accomplished through household surveys, which are extremely time-consuming in terms of data collection. However, it is difficult to observe the travel behavior of urban residents on a large scale and over a long period of time due to the low sampling rate, high cost, and poor timeliness of survey methods. With the rapid development of information technology and mobile internet in recent years, an increasing number of new means (such as vehicle GPS, social networking sites, smart cards, and so on) can help to record the long-term activity trajectory of urban residents. Jiang et al. [5] examined GPS data from taxis in several Swedish cities and discovered that the riding distance of taxi passengers followed a two-stage power-law distribution. Based on larger-scale GPS data, Liang et al. [6] investigated the ride distance distribution characteristics of taxi passengers and discovered that the ride distance obeyed the exponential distribution rather than the previously reported power-law distribution. People’s daily travel patterns, such as trip demand, trip distance, and trip duration, have changed throughout the pandemic. We can mine the travel characteristics of different stages within the epidemic and efficiently percept the crowding regions using mobility data [7].
People’s travel behavior is greatly influenced by the spread of infectious diseases. Some post-policy measures, such as forced blockade, can typically reduce outdoor activities. As a result, the number of people using public transportation has dropped dramatically. In many European countries, public transportation lost more than 80% of its passengers in the early stages of the pandemic [8]. According to taxi data collected in Chicago, the number of taxi passengers was reduced by 95%, and taxi operations were reduced by 85 percent, as a result of the United States’ “Stay at Home Order” issued in March 2020 [9]. According to taxi trip data from Shenzhen, China, taxi demand in Shenzhen decreased by more than 85% during the blockade stage [10]. Travelers prefer relatively uncrowded modes of transportation, such as a private car or taxi transport, for safety reasons and fear of infection, even during the recovery stage, while few use public transportation. According to an IBM survey of adults in the United States, travelers’ attitudes toward public transportation have shifted significantly. More than 20% of respondents said they no longer use the bus, subway, or train, and another 28% said they may reduce their use. More than half of those polled said they would cut back on carpooling, and 24% said they would no longer use taxis for long-distance travel [11]. Willberg et al. [12] investigated urban-rural mobility and the impact of multi-local living on population dynamics in Finland during the COVID-19 crisis using three mobile phone datasets. The findings revealed a significant decrease in urban mobility and an increase in rural population. Some COVID-19 mitigation measures, such as national border closures, impacted transnational people who frequently cross borders for work, shopping, and other purposes. Järv et al. [13] investigated the impact of the COVID-19 pandemic on people’s daily lives from the standpoint of transnational people. International people’s daily spatial mobility decreased sharply, but as restrictions were gradually eased, they began to flock to their second homes.
On the one hand, the spread of COVID-19 has an impact on people’s travel behavior at various stages. People’s trip demand, for example, is significantly reduced when an epidemic breaks out. However, as the epidemic recovers, more trips emerge. On the other hand, perception of residents’ travel patterns can aid in the prediction of the spread of infectious diseases. The use of public transportation, train travel, and air travel will accelerate the spread of the virus, while appropriate travel restrictions and social distance measures will slow its spread [14]. Previous research has shown that people’s travel habits can influence thespread of COVID-19. It has been discovered that there is a link between population flow patterns and virus transmission in China, which has spread more rapidly as a result of increased globalization. According to research, China’s strict control measures have significantly slowed the spread of the pandemic [15, 16]. Similar findings are proposed, and it is discovered that the main reason for the virus’s rapid spread is the large number of passengers entering and leaving Wuhan during the Spring Festival [17]. Meanwhile, for the higher/lower infection risk, it is necessary to tighten/loosen restrictions on residents’ travel.
Relevant studies on historical epidemics can inform the travel pattern analysis under COVID-19. MERS-CoV emerged in 2012 and has spread to more than 26 countries. To date, all reported cases have either occurred in the Middle East or have been associated with the region through passenger air travel, with the largest outbreak occurring in South Korea [18, 19]. Gardner et al. [20] adopted a transportation network modeling framework to quantify the risk of international transmission of MERS-CoV through air travelers. Considering the transmission routes, the countries with the highest input risk of MERS-CoV were identified. The result shows that this study provides a risk analysis approach by using travel patterns to prioritize countries with the highest risk of MERS-CoV importation, which requires good case surveillance at airports to stop outbreaks in the country. Some studies focus on examining the impact of public fear of epidemics on travel behavior. Kim et al. [21] studied the public fear caused by the MERS outbreak in South Korea, which led to a significant decrease in public transportation use in the Seoul Metropolitan Area. Smart card data were used for the analysis, and the results showed that subway use was much more affected than bus use. The number of people at subway stations is higher than that at bus stops, and people may suspect a higher risk of infection at subway stations. Goubar et al. [22] developed a model to estimate the number of SARS cases entered between regions and applied the model to two scenarios: from Beijing to Frankfurt and from Hong Kong to London. The experimental results are consistent with the observations in real-world cases. Al-Tawfiq et al. [23] suggested that frequent travel mobility increases the rate of transmission of SARS and MERS-CoV. For travelers, attention needs to be paid to their travel history. If there is an infection, finding the exact transmission route is critical to subsequently prevent the virus from entering the human population. Cohen et al. [24] provided some measures to prevent the international spread of Ebola. International travel restrictions and border closure policies play an important role in slowing the spread of deadly infectious diseases [25].
Although there have been numerous studies on the effects of COVID-19 on city trip patterns, previous research has primarily focused on the impact of trip demand. The goal of this study is to investigate the city’s trip patterns at various stages of the pandemic. Based on taxi trip data collected in New York City (NYC) over the last three years, we examine changes in the spatiotemporal characteristics of taxi trips during the pre-COVID-19 period, the COVID-19 outbreak period, and the COVID-19 recovery stage. There is also research into quantitative measurements of the correlation between trip patterns and COVID-19.
Data description
For this study, there are two data sources including taxi trip data and COVID-19 data of NYC, USA. The taxi trip data over an almost three-year period (Jan. 2019–Aug. 2021) (data source: https://www1.nyc.gov/site/tlc/about/tlc-trip-record-data.page) are used to analyze the trip patterns in the city. This data covers six counties in NYC including Manhattan, Queens, Brooklyn, Bronx, EWR, and Staten Island as shown in Figure 1. The key taxi trip data typically includes the start and end geocoordinates (latitude and longitude), the start and end timestamps, trip distance, passenger count, and other information. After cleaning the data, we have approximately 124 million valid taxi rides.
In addition, to analyze the effects of COVID-19 on trip patterns, we use NYC covid data, which reported the number of confirmed COVID-19 cases, the death toll, and the death rate for each day of 2020 (data source: https://github.com/nytimes/COVID-19-data).
Quantitative measurements for the influence of COVID-19
Similarity measurement with dynamic time warping distance
To investigate the influence of COVID-19 on the temporal trip patterns, it is necessary to analyze the similarity for two given time series. Dynamic Time Warping distance (DTW) is first proposed to measure the similarity of two-time series by Giorgino in 2009 [26]. It not only overcomes the limitation of point-to-point matching in the calculation of Euclidean distance but also achieves the metric of unequal time series, which means the distance between two-time series can be calculated even if their lengths differ [27].
To analyze the similarity of two temporal trip demand time series at different stages of COVID-19, the DTW algorithm is used in this paper. Here, we define two- time series based on the taxi data of NYC. The hourly taxi trip demand in the T month and 𝑇′ month is 𝑆 = {𝑠1, 𝑠2, … , 𝑠𝑖, … , 𝑠𝑛} and 𝑄 = {𝑞1, 𝑞2, …, 𝑞𝑗, … , 𝑞𝑚} , respectively. We first arrange the series S and Q to form an n × m distance matrix where each grid point d(i, j) is calculated by Equation (1),
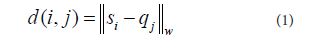
where d(i, j) is the distance between two time-series elements si and qj, i = 1, 2 … , n, j = 1, 2, … , m. In general, two measures are usually used for a distance function d(i, j), which is the Manhattan distance with the w = 1 and the Euclidean distance with the w = 2. To calculate the DTW of time series s and Q, an optimal sequence P is obtained with Equation (2), which formulates the DTW(S, Q) as a dynamic programming problem, so that the cumulative distance values of time series S and Q can be minimized.
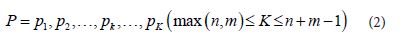
where P is a sequence of time-series elements, where each si corresponds to the matching relationship between pk and qj . There exist multiple time-warping paths, and the path P should satisfy the three requirements given below.
- The boundedness constrain: P1 = (1,1), Pk = (n, m)
- The monotonicity constrain: given PK = (i, j) and Pk+1 = (i’, j’) , the i’ ≥ i and j’ ≥ j exist.
- The continuity constrain: given PK = (i, j) and Pk+1 = (i’, j’), the i’ ≤ i + 1 and j’ ≤ j + 1 exist.
The boundedness constrain ensures that the starting point is P1 = (1,1) and the ending point is pk = (n, m), which lies at the lower left and upper right corners of the distance matrix dn×m in Figure 2. The monotonicity and continuity constraints describe that to obtain a minimum cumulative distance, the time series can be warped to the next time point. For example, the grid point (si−1, qj−1) can be warped to (si, qj−1), (si−1, qj), (si, qj) to compute each distance [19]. Among the valid paths, the optimal path is found such that the cumulative distance is minimized, as in Equation (3).
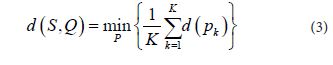
Equation (3) can be solved with a dynamic programming method. Figure 2 illustrates the process of the calculation of DTW. The starting point of sequence P is (𝑠0, 𝑡0) while the ending point is (𝑠𝑚, 𝑡𝑛). The blue line 𝑑(𝑆, 𝑄) is the DTW distance between the two temporal trip demand series S and Q.
Correlation measurement of COVID-19 and city trip
The spread of COVID-19 alters people’s travel patterns, which vary depending on the stage of the pandemic. During a COVID-19 outbreak, mandatory lockdown policies and the fear of infection usually cause changes in people’s travel patterns. The number of trips and long-distance trips increases as the infection rate slows down since people are vaccinated [12]. The COVID-19 virus, on the other hand, can mutate, and the impact on travel patterns changes as the number of confirmed cases and death rate rises. As a result, it is necessary to investigate the relationship between the various stages of COVID-19 and trip patterns.
In the COVID-19 data of NYC, the daily confirmed cases and the death toll series are defined as 𝑋𝑐 and 𝑋𝑑. Besides, in the NYC taxi data, the corresponding series of trip demand, trip distance, trip duration, and the number of grouped passengers are 𝑌𝑎, 𝑌𝑑, 𝑌𝑢, 𝑌𝑝. To study the relationship between the number of confirmed cases and taxi travel patterns during the COVID-19 pandemic, the Pearson coefficient 𝜌(𝑋𝑐, 𝑌𝑎), is used to calculate the correlation daily confirmed cases series 𝑋𝑐 and trip demand series 𝑌𝑎, in Equation (4) [28]. To explore the corresponding relationships at different stages of COVID-19 with different variables, a similar process can be applied for obtaining the Pearson’s correlation coefficient such as 𝜌(𝑋𝑐, 𝑌𝑑), 𝜌(𝑋𝑐, 𝑌𝑢), 𝜌(𝑋𝑐, 𝑌𝑝), 𝜌(𝑋𝑑, 𝑌𝑎), 𝜌(𝑋𝑑, 𝑌𝑑), 𝜌(𝑋𝑑, 𝑌𝑢) and 𝜌(𝑋𝑑, 𝑌𝑝).
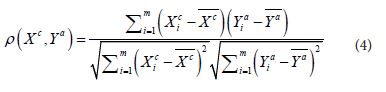
In Equation (4), m is the length of the daily trip demand series, Xc is the average of daily infected people, Ya is the average value of daily trip demand. The Pearson’s correlation coefficient not only states the presence or the absence of the correlation between the two variables but also determines the exact extent to which those variables are correlated. The coefficient ranges from the value +1 to the value -1. It indicates a negative relationship with P < 0 while a positive relationship with P > 0 . If the correlation coefficient P is equal to 0, it indicates no relationship between the two variables.
Results and analysis
Temporal taxi trip amount during COVID-19
We present the number of new confirmed cases and deaths per day in NYC based on data from the United States COVID-19 report. Figure 3 depicts the epidemic situation in NYC in 2020, including the number of confirmed cases, death toll, and death rate. Figure 3(a) shows that the number of confirmed cases increased from March to April of 2020 and from November to December of 2020. Although the number of confirmed cases increases from May to October 2020, the rate of growth is much slower. Figure 3(b) depicts the death toll from the 2020 epidemic in NYC, which begins to rise in April and continues to rise from May to November, albeit at a significantly higher rate from November to December. Figure 3(c) depicts the death rate of infected people in NYC. It can be seen that the rate increased rapidly after April 2020 and then began to fall, with the highest infection death rate reaching around 8%.
Figure 4 depicts the number of taxi rides in NYC per day in 2019, 2020, and 2021. The trip demand in 2019 is relatively stable, but it is slightly lower in July and August. The first case of COVID-19 reported in the United States appears on January 21st, 2020, but there are no new cases in NYC from January to March 2020. As a result, demand has not been affected, with approximately 200,000 rides per day stashed. On March 1st, 2020, the first confirmed case of COVID-19 was reported in NYC. And, predictably, taxi demand has declined sharply since the emergence of the first case in Figure 4. From April to August 2020, daily taxi demand falls below 5,000 rides, a drop of more than 75% compared to the pre-first-case scenario. Though the number of trips has gradually increased since September 2020, the rate of increase has remained relatively slow. The year 2021 was still plagued by COVID-19, but due to the gradual normalization of the epidemic and an increase in population vaccinations, demand has begun to recover, though it remains low when compared to daily rides in previous years in history.
Spatial mobility patterns during COVID-19
The taxi travel records from January 2020 (pre-COVID-19), April 2020 (COVID- 19 outbreak period), and July 2020 (COVID-19 recovery stage) have been selected separately to study the spatial distributions of taxi pick-up and drop-off demand, as shown in Figure 5. In January 2020, the hotspots for taxi pick-ups are crowded around Manhattan and Queens county, with 484,982 trips recorded in the Upper East Side South area and 369,546 trips recorded in the JFK Airport area of Queens, as shown in Figure 5 (a). As illustrated in Figure 5 (b), the hotspot for taxi pick-ups in April 2020 is reduced to the Manhattan neighborhood alone, and trip demand in the Upper East Side North area is 15,576, which is 96.79 percent lower than the situation in January. During the epidemic’s recovery stage, which begins in July 2020, taxi demand in NYC gradually increases. The taxi pick-up hotspots have been returned to two busy districts, namely Manhattan and Queens. Figure 5(c) shows that in the Upper East Side South area of Manhattan, 57,372 rides are recorded in July, which is approximately 3.68 times more than in April.
The spatial distribution of taxi drop-off demand in NYC is depicted in Figures 5(d) to 5(f). Taxi travel hotspots will be distributed in Manhattan and Queens in January 2020. In April 2020, the taxi hotspots are only concentrated in the Manhattan block, where demand is significantly reduced. However, during the epidemic recovery stage, which begins in July 2020, the drop-off demand and number of hotspots gradually increased.
Figure 6 depicts the trip demand gap for each region at various stages of the epidemic, which is the difference between pick-up and drop-off demand. In January 2020, there is a significant demand gap for taxis in NYC, particularly in Manhattan, Queens, and Brooklyn as shown in Figure 6(a). On the contrary, the number of taxi trips decreases in April 2020, and the demand gap between pick-up and drop-off demand is relatively small. During the epidemic's recovery stage, the demand gap widens, particularly at JFK Airport in Queens County. The inflow demand is far greater than the outflow demand, indicating that more and more people are flocking to NYC during the recovery stage of COVID-19.
Every taxi trip has an origin and a destination, and we use this information to create origin-destination (OD) pairs to study trip distribution in NYC. Figure 7 depicts the geographic distribution of taxi origin-destination trips during the epidemic’s various stages. Figure 7(a) shows that before the epidemic, OD trips were widely distributed across different regions, such as intra-city and inter-city trips in Manhattan county, Queens county, Brooklyn county, and Bronx county. These districts are densely populated commercial and industrial hubs. The total number of trips starting from the Manhattan block is 5,854,937. There are 5,588,813 orders with origins and destinations all in the Manhattan block, accounting for 95.45 percent of them. Furthermore, there are 213,382 orders from Manhattan block to Queens block, accounting for 3.64 percent of total orders. As shown in Figure 7(b), when the epidemic occurred in March 2020, the OD distribution of taxi orders generated more trips within the Manhattan block and fewer trips to other farther blocks. There are 205,694 orders with origins and destinations in Manhattan block and only 3,308 orders with origins and destinations in Queens block. Figure 7(c) depicts the OD distribution of taxis in July 2020, during the epidemic’s recovery stage. The number of taxi orders grew gradually. In July, 706,145 orders left Manhattan block, with 672,012 orders arriving at Manhattan block. During the epidemic’s recovery stage, the majority of orders continue to emerge in the Manhattan block, but orders to other blocks are gradually increasing.
The influence of COVID-19 on group travel behavior
The number of passengers for each trip is recorded in the taxi data. In this section, we examine the changes in group travel behavior in NYC at various stages of the epidemic. Group travel behavior is defined as two or more people traveling together on purpose during (part of) a trip [29]. The group travel rate is calculated by dividing the number of group travel trips by the total number of trips. Figure 8 depicts the number of group travel trips and the group travel rate during the epidemic. The number of group travel orders in 2019 is relatively stable, with a slight decrease in July and August. With an average of 6,728 orders per day in 2020, a large number of group travel trips exit before the epidemic. The COVID-19 outbreak has sharply reduced the number of group travel orders, with only an average of 134 orders per day. During the epidemic’s recovery stage, the number of group travel orders steadily increased to an average of 1,378 orders per day in December. It can be seen that the rate of group travel has also changed before and after the pandemic outbreak. Overall, the group travel rate decreases in the early stages of the epidemic and then gradually increases during the recovery stage, but the value of the companion rate remains lower than before the epidemic.
The OD distribution of group travel orders at various stages of the epidemic is shown in Figure 9. Before the pandemic, many group travel orders are widely distributed in Manhattan, Queens, Brooklyn, and the Bronx, but the majority of them vanished with the outbreak of COVID-19. When the pandemic has recovered to some extent, group travel behaviors will become more visible.
COVID-19 impacts on the trip distribution
We examine the trip distributions of taxi passengers at different phases of COVID- 19, including the trip distance, trip duration, and trip speed. Here the power-law distribution, power law with an exponential cutoff, log-normal distribution, and exponential distribution are chosen as candidates to fit the travel distribution [17].
The power law that follows a distribution with exponent 𝛽 is shown in Equation (5).
The power-law distribution with exponential cutoff is defined in Equation (6), where 𝛽 is the exponent and 𝜅 is the cutoff value
The probability density function of the log-normal distribution is in Equation (7), where 𝜇 and 𝜎 denote the mean and standard deviation of the natural logarithm of the variable.
The probability density function of the exponential distribution is in Equation (8), and b is the rate parameter.
Logarithmic binning has been proposed as a useful technique for reducing statistical errors in the tails of empirical power-law-like distributions [17]. Figure 10 depicts the taxi trip distribution and group travel distribution using a double-log plot. The trip distance distribution in April 2020 is depicted in Figure 10 (a). A peak appears in the purple circle after a trip distance of 11km, indicating that people use taxis for commuting. As shown in Figure 10 (b), this peak became less visible in April 2020, indicating that the few people commuting by taxi during the epidemic. We use three distribution functions to fit the taxi trip distance distribution, namely power-law distribution with exponential truncation (PLEXP), lognormal distribution (LN), and exponential distribution (EXP), in Equations. (5) - (8). When compared to the lognormal distribution (LN) and the exponential distribution (EXP), the power distribution with exponential truncation (PLEXP) fits the trip distance distributions better.
Figure 10 (d)-(f) depicts the trip duration distribution at various stages of the COVID-19. The exponential distribution (EXP) can better fit the taxi travel time distribution in January 2020 (before the epidemic). Due to the trip duration disturbance, the fitting effect is not as good as it was before the epidemic outbreak (in April 2020). The trip duration gradually becomes stable during the recovery stage (in July 2020), and the exponential distribution (EXP) can fit the taxi travel time distribution well again.
Based on the trip distance and duration in each taxi travel record, the trip speed can be calculated. In Figure 11, we examine daily speeds in 2019 and 2020 during peak and off-peak hours. In general, trip speeds are faster during off-peak hours than during peak hours of 7:00-9:00 and 17:00-1900. In 2019, taxi trip speeds change steadily, and the average trip speeds in peak hours are much lower than that in non-peak hours. Because there were fewer trip demands and nearly no traffic congestion on the road when the virus broke out in 2020, taxis’ peak and off-peak speeds dramatically soared. With the recovery of taxi trips on the road during July 2020, the driving speed gradually decrease but remains higher than in the same period in 2019.
Similarities in trip demand estimation during COVID-19
The DTW distance is used to examine the similarity of taxi demand. The time series of the DTW distance of the taxi trip demand series in 2020 is shown in Figure 12(a). We can see that the DTW distance of taxi trip demand between January and February is 3.6, which is minimal and shows a high degree of similarity. Taxi trip demand begins to fall in March 2020 as a result of COVID-19, and their DTW distance gradually increases. Between January and March, the DTW distance of taxi trip demand is 33, while between January and April, it is 62. In January and April, the large value of DTW distance demonstrates the differing travel patterns. The DTW distance reduces during the epidemic’s recovery stage, indicating that close similarity is approaching. For example, between January and October, the DTW distance of taxi trip demand is 47 miles. As a result, the DTW distance can accurately represent and convey the similarity of the monthly trip demand time series.
Figure 12(b) depicts the DTW distance of taxi trip demand from 2019 to 2021. We can see that COVID-19 has no effect on taxi trip demand in 2019. The DTW distance between each month is minimal, indicating the high similarity of travel patterns. Trip demand swings dramatically in March 2020 as a result of COVID-19, and the DTW distance is greater than in previous months. Taxi trip demand progressively improves in 2021, and taxi trip travel patterns become similar.
Correlation analysis of COVID-19 and city trip
between different COVID-19 stages and trip patterns. The analysis of the travel demand at various stages of COVID-19 is as follows. Before the outbreak of COVID-19, the average daily travel demand is 208,296.56 in Jan.-Feb. In Mar. and Apr., the outbreak of COVID-19 decreases the daily travel demand by 74.92%, with an average of 52,242.18 trips per day. In May. and Jun., the COVID-19 continues to spread and the number of infected people increased dramatically, which reduces the daily travel demand by 93.20% compared to the daily travel demand before the COVID-19. The average number of trips from Jul. to Aug. is 28,102.69, with a 1.98 times increase compared to that in May. and Jun. The average daily travel demand is 48,263.14 in Sep.-Oct. and 47,615.39 in Nov. and Dec., respectively. Although the number of infected people continued to increase, the number of trips become stable. The impact of the COVID-19 on people’s daily travel is not as great as when the epidemic first occurred. The average trip duration is 12.86 minutes in Jan. and Feb. before the COVID-19 outbreak, while reduces to 10.32 minutes in Mar. and Apr. during the outbreak. It can be seen that the impact of the COVID-19 has reduced the trip duration by taxi. The average trip duration in Jul. and Aug. is 11.83 minutes and 12.15 minutes in Sep. and Oct. Longer travel duration appears during the recovery period of the epidemic. Besides, the average travel distance is 2.92 km before the COVID-19 outbreak. The average travel distance is 3.08 km in Jul. and Aug. and 3.69 km in Sep. and Oct.
During the epidemic, the number of short- distance trips by taxi decreases, which is substituted by the use of bicycles or walking. For longer trips, for example, over 3 km, people are more likely to choose taxis, which is less likely to be infected compared to using the bus and subway.
Table 1 shows the results of a Pearson correlation test between characteristics linked to taxi travel and the number of verified COVID-19 cases/deaths. Figure 13 shows the related combined distributions of relative variables. The Pearson correlation coefficient between the number of confirmed cases and taxi trip demand is 𝜌(Cases, Demand). 𝜌(Cases, Demand) is -0.59 when COVID-19 is released in March 2020, indicating a negative association between the number of confirmed cases and taxi trip demand. This negative figure indicates that as the number of verified cases of COVID- 19 rises, so does the demand for taxi rides. 𝜌(Cases, Duration) represents the Pearson correlation coefficient between the number of confirmed cases and the trip distance of taxi trips. 𝜌(Cases, Duration) is -0.49 with the data from March to April, indicating that an increase of confirmed cases causes the reduced trip duration. 𝜌(Cases, Distance) denotes the Pearson correlation coefficient between the number of confirmed cases and the trip distance of taxi trips. 𝜌(Cases, Distance) is 0.31 during March to April, which means when the average trip distance is longer, the number of confirmed cases is high accordingly. 𝜌(Cases, Passenger) is the Pearson correlation coefficient between the number of confirmed cases and the average passenger count. 𝜌(Cases, Passenger) is - 0.59 shows that a small number of passengers travel with more confirmed cases. The associations between characteristics connected to taxi travel and the number of confirmed cases/deaths are never fixed during successive stages of COVID-19. For example, 𝜌(Cases, Demand) is 0.37 from July to August 2020. The number of confirmed cases continues to rise, resulting in more taxi rides. Because the prevalence of infection declines and more individuals are vaccinated, the total number of trips and long-distance trips increases.
Conclusion
Since the outbreak of the COVID-19 global pandemic, transportation, and many other industries have been severely impacted. The spread of the epidemic influences people’s travel behavior, which varies dynamically at various stages of the COVID-19. Trip demand is significantly reduced at the start of the outbreak. However, as the infection rate has slowed and more people have been vaccinated, trip demand has gradually increased. Based on taxi records in NYC from 2019 to 2021, this study aims to investigate travel behavior at various stages of the pandemic and analyze the following components before, during, and after the COVID-19 pandemic. 1) changes in the spatiotemporal characteristics of taxi mobility, 2) changes in taxi travel companion behavior, i.e., to travel with someone, 3) the distribution of taxi travel characteristics, and 4) the impact of the COVID-19 pandemic on travel characteristics. As a result, demand for taxi rides in NYC drops by more than 75% during the outbreak. Although the figure has gradually increased during the recovery stage, it is still difficult to return to pre-epidemic levels. From a spatial standpoint, the number of travel hotspots has decreased since the outbreak, and taxi orders are highly concentrated within specific regions. When it comes to significant changes in group travel behavior, most travelers prefer to travel alone, resulting in a downward trend in the proportion of travelers traveling with companions. The DTW distance is used to investigate the similarity of trip demands at various stages, and the analysis reveals that it can dynamically reflect the evolution of travel characteristics.
This work is based on epidemic data and taxi orders in NYC, but in future studies, functional characteristics of each region can be included to investigate changes in travel purposes during the COVID-19. Furthermore, the integration of multiple modes of transportation, such as buses and bikes, can be included to reflect travel mode choice during the pandemic.
Acknowledgement
Author appreciates Dr. Chang’s help in the discussions and figure-making
- Abdullah M, Ali N, Hussain S, Aslam A, Javid M (2021) Measuring changes in travel behavior pattern due to COVID-19 in a developing country: A case study of Pakistan. Transport Policy 108: 21–33.
- WHO (2020) Coronavirus disease (COVID-19) pandemic. Retrieved 74, 2020.
- Egu O, Bonnel P (2020) How comparable are origin-destination matrices estimated from automatic fare collection, origin-destination surveys and household travel survey? An empirical investigation in Lyon. Transportation Research Part A: Policy and Practice 138: 267-82.
- Chang X, Wu J, Liu H, Yan X, Sun H, Qu Y (2019) Travel mode choice: a data fusion model using machine learning methods and evidence from travel diary survey data. Transportmetrica A: Transport Science 15: 1587–612.
- Jiang B, Yin J, Zhao S (2009) Characterizing the human mobility pattern in a large street network. Physical Review E 80: 021136.
- Liang X, Zheng X, Lv W, Zhu T, Xu K (2012) The scaling of human mobility by taxis is exponential. Physica A: Statistical Mechanics and its Applications 391: 2135-44.
- Aghabayk K, Esmailpour J, Shiwakoti N (2021) Effects of COVID-19 on rail passengers’ crowding perceptions. Transportation Research Part A: Policy and Practice 154: 186-202.
- Chapuis R, Tadjeddine K, David C, Holmes R, Knol A, et al. (2020) Restoring public transit amid COVID-19: What European cities can learn from one another. 2020.
- Ale-Ahmad H, Mahmassani HS (2020) Impact of COVID-19 on taxi operation in Chicago.
- Zheng H, Zhang K, Nie Y (2021) Plunge and rebound of a taxi market through COVID- 19 lockdown: Lessons learned from Shenzhen, China. Transportation Research Part A: Policy and Practice 150: 349-66.
- IBM (2020) COVID-19 Is significantly altering U.S. consumer behavior and plans Post- Crisis. Technical Report. IBM 2020.
- Willberg E, Järv O, Väisänen T, Toivonen T (2020) Escaping from cities during the COVID-19 crisis: Using mobile phone data to trace mobility in Finland. International Journal of Geo-Information, 2020 10: 103.
- Järv O, Tominga A, Müürisepp K, Silm S (2021) The impact of COVID-19 on daily lives of transnational people based on smartphone data: Estonians in Finland. J Location Based Services, 15: 169-97
- Otsuki S, Nishiura H (2016) Reduced risk of importing Ebola virus disease because of travel restrictions in 2014: a retrospective epidemiological modeling study. PloS One 11: e0163418.
- West R, Michie S, Rubin GJ, Amlˆot R (2020) Applying principles of behaviour change to reduce SARS-CoV-2 transmission. Nature Human Behaviour 4: 451-9.
- Li J, Li S, Cao W, Wang Z, Liang Z, et al. (2021) Appraisal of China’s response to the outbreak of COVID-19 in comparison With SARS 9: 830.
- Peeri NC, Shrestha N, Rahman MS, Zaki R, Tan Z, et al. (2020) The SARS, MERS and novel coronavirus (COVID-19) epidemics, the newest and biggest global health threats: what lessons have we learned? 2020. Int J Epidemiol 49: 717-26.
- Soliman T, Cook AR, Coker RJ (2015) Pilgrims and MERS-CoV: what’s the risk? Emerg Themes Epidemiol 12: 3.
- Al-Tawfiq JA, Omrani AS, Memish ZA (2016) Middle east respiratory syndrome coronavirus: current situation and travel-associated concerns. Frontiers of Medicine 10: 111-9.
- Gardner LM, Chughtai AA, MacIntyre CR (2016) Risk of global spread of Middle East respiratory syndrome coronavirus (MERS-CoV) via the air transport network. J travel medicine 23: taw063.
- Kim C, Cheon SH, Choi K (2017) Exposure to fear:Changes in travel behavior during MERS outbreak in Seoul.KSCE J Civil Engineering 21: 2888–95.
- Goubar A, Bitar D (2009) An approach to estimate the number of SARS cases imported by international air travel. Epidemiology & Infection 137: 1019-31.
- Al-Tawfiq JA, Zumla A, Memish ZA (2014) Travel implications of emerging coronaviruses: SARS and MERS-CoV.Travel medicine and infectious disease 12: 422-8.
- Cohen NJ, Brown CM, Alvarado-Ramy F, Bair-Brake H, Cetron M (2016) S Travel and border health measures to prevent the international spread of ebola Mmwr Suppl 65: 57-67.
- Siewe N, Lenhart S, Yakubu AA (2020) EBOLA outbreaks and international travel restrictions: case studies of central and west Africa regions. J Biological Systems 2020: 1-22.
- Giorgino T (2009) Computing and visualizing dynamic time warping alignments in R: The DTW package. J Statistical Software 31: 1–24.
- Li H, Bruno A, Trépanier M (2018) A classification of public transit users with smart card data based on time series distance metrics and a hierarchical clustering method. Transportmetrica A: Transport Science 16: 1-19.
- Abdullaha M, Diasb C, Muley D, Shahinc M (2020) Exploring the impacts of COVID-19 on travel behavior and mode preferences. Transportation Research Interdisciplinary Perspectives 8: 100255.
- Zhang Y, Karel M (2018) An explorative analysis of group travel behaviour pattern in the public transit context. In Proceedings of Transportation Research Board 97th Annual Meeting, Washington DC, United States.
FIGURE 1
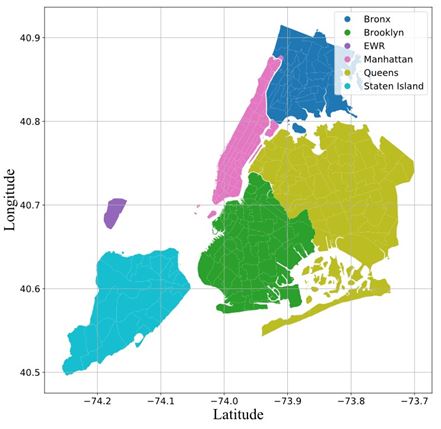
Figure 1: New York City, the study area
FIGURE 2
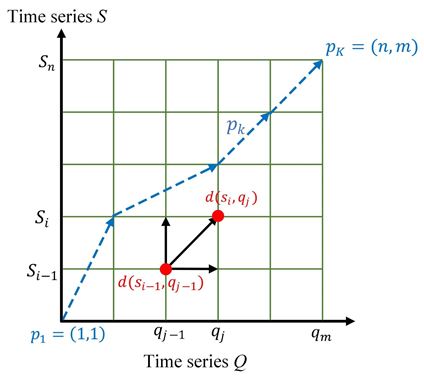
Figure 2: Example of DTW()()()
FIGURE 3
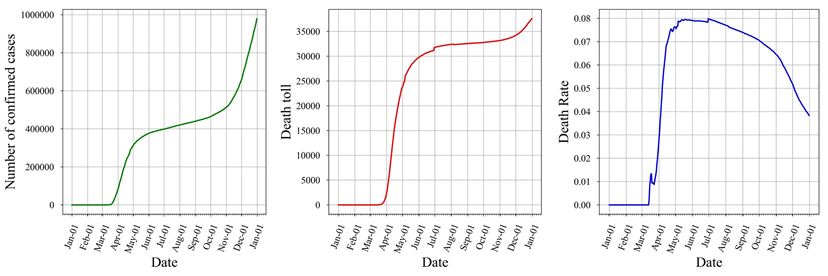
Figure 3: COVID-19 report data in NYC (a) Number of confirmed cases per day; (b) Death toll per day; (c) Death rate per day
FIGURE 4
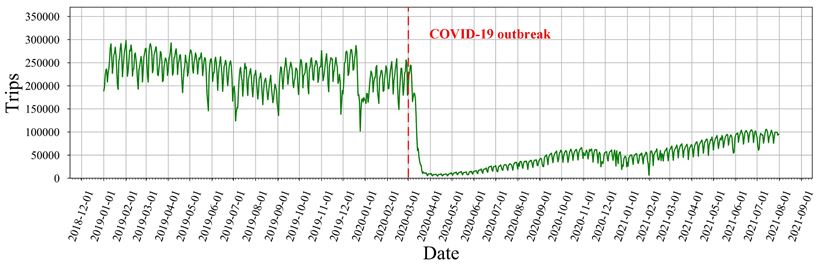
Figure 4: Daily taxi trips of NYC in 2019, 2020, and 2021
FIGURE 5
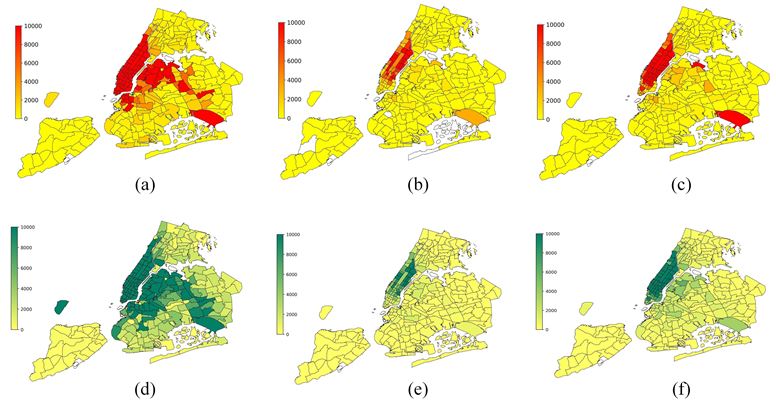
Figure 5: Spatial distribution of taxi trip demand in NYC. (a) Pick-up demand in January 2020; (b) Pick-up in April 2020; (c) Pick-up in July 2020; (d) Drop-off demand in January 2020; (e) Drop-off demand in April 2020; (f) Drop-off demand in July 2020
FIGURE 6
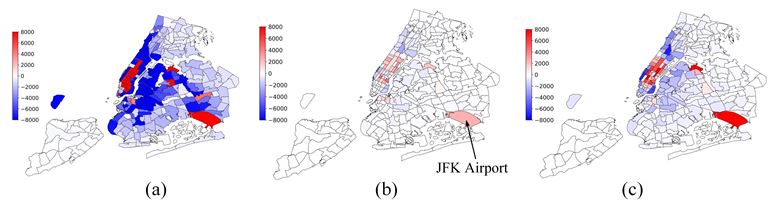
Figure 6: Spatial distribution of the trip demand gap in NYC (a) January 2020; (b) April 2020; (c) July 2020
FIGURE 7
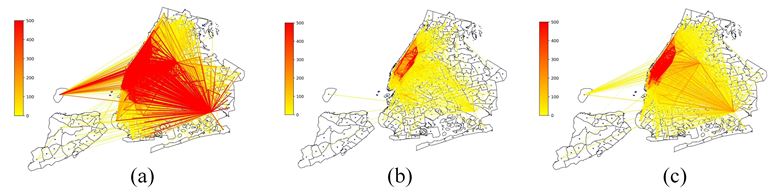
Figure 7: Geographic distribution of taxi origin-destination trips in NYC (a) January 2020; (b) April 2020; (c) July 2020
FIGURE 8
.JPG)
.JPG)
Figure 8: Group travel characteristics in 2019, 2020, and 2021 for NYC taxi trip data (a) number of trips in the group travel; (b) group travel rate
FIGURE 9
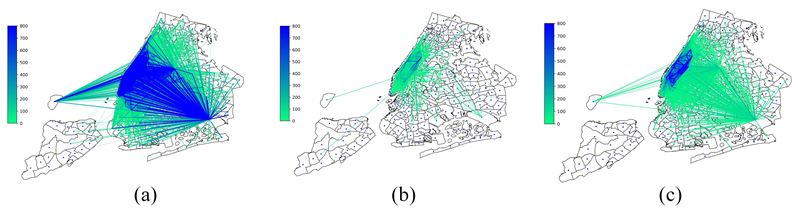
Figure 9: Geographic distribution of group travel for NYC taxi trip data (a) January 2020; (b) April 2020; (c) July 2020
FIGURE 10
.JPG)
.JPG)
Figure 10: Taxi trip distribution and group travel distribution at various stages during the pandemic
FIGURE 11
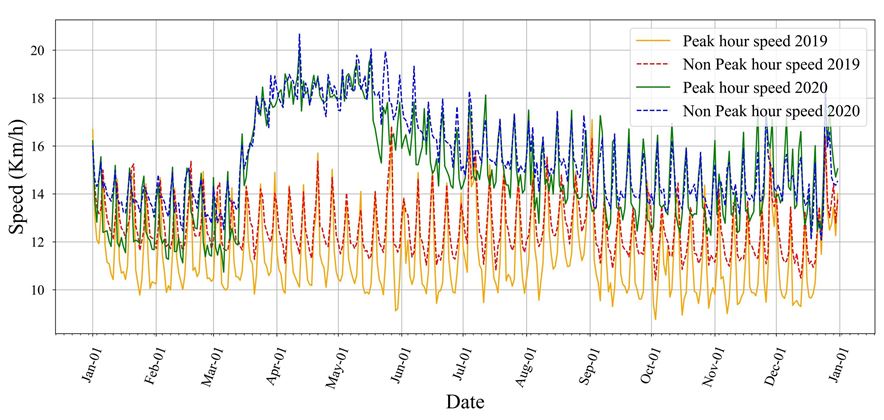
Figure 11: Peak hour speed and off-peak hour speed of NYC taxi trips in 2019 and 2020
FIGURE 12
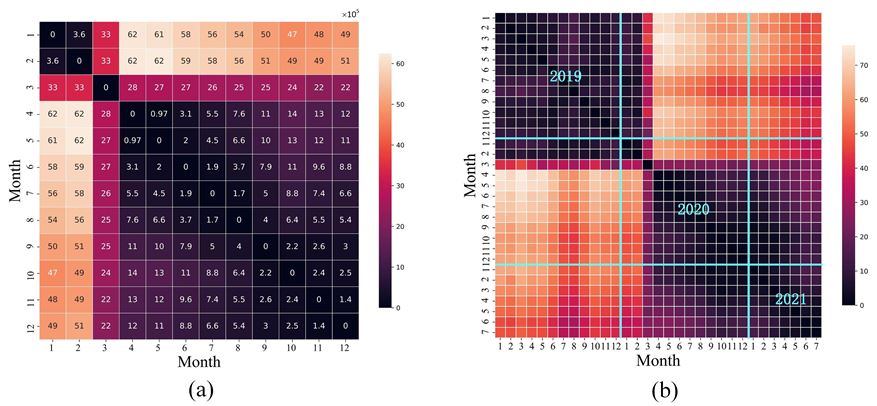
Figure 12: DTW distance of taxi trip demand at various stages of COVID-19
FIGURE 13
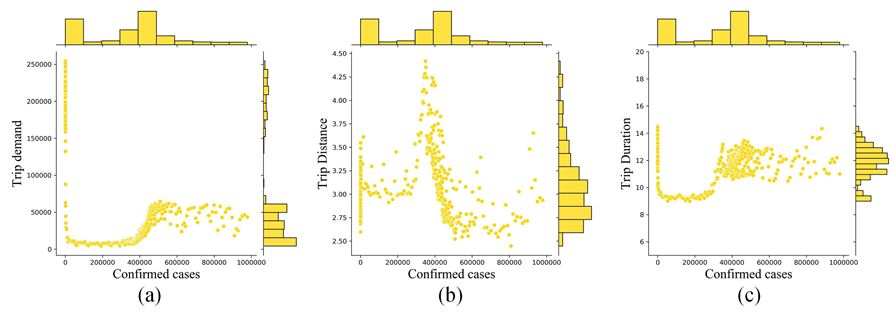
Figure 13: Correlation analysis of confirmed cases and taxi trip characteristics. (a) trip demand; (b) trip distance; (c) trip duration
Tables at a glance
Figures at a glance