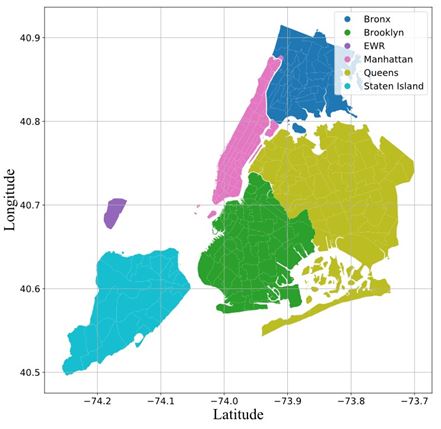
Figure 1: New York City, the study area
Figure 1: New York City, the study area
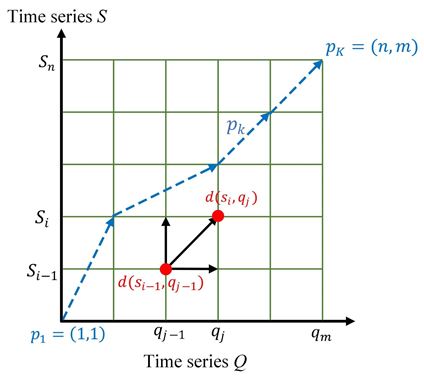
Figure 2: Example of DTW()()()
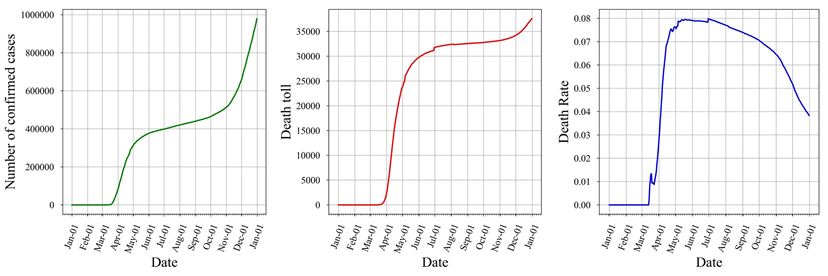
Figure 3: COVID-19 report data in NYC (a) Number of confirmed cases per day; (b) Death toll per day; (c) Death rate per day
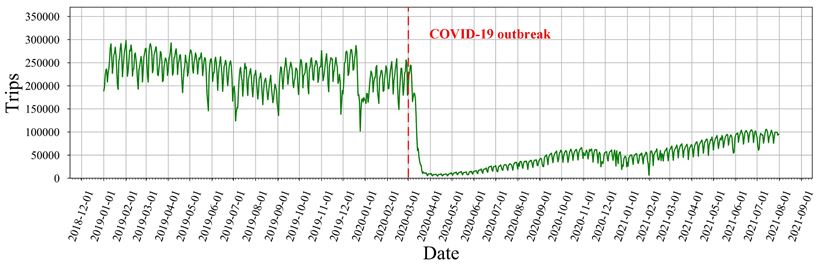
Figure 4: Daily taxi trips of NYC in 2019, 2020, and 2021
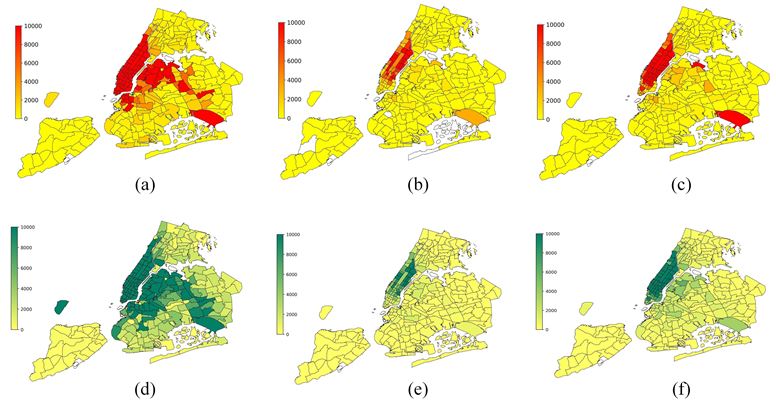
Figure 5: Spatial distribution of taxi trip demand in NYC. (a) Pick-up demand in January 2020; (b) Pick-up in April 2020; (c) Pick-up in July 2020; (d) Drop-off demand in January 2020; (e) Drop-off demand in April 2020; (f) Drop-off demand in July 2020
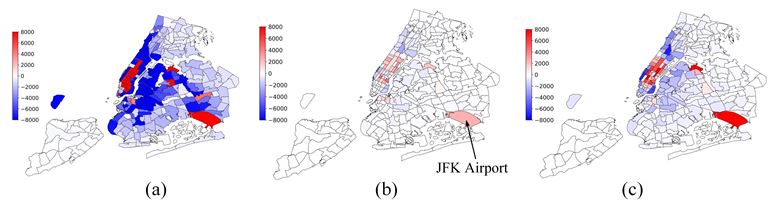
Figure 6: Spatial distribution of the trip demand gap in NYC (a) January 2020; (b) April 2020; (c) July 2020
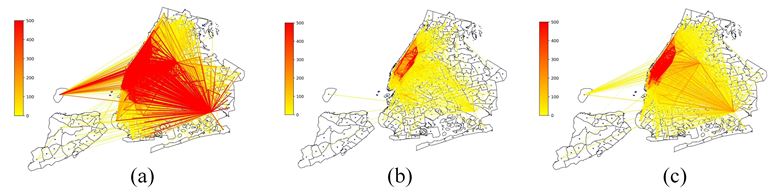
Figure 7: Geographic distribution of taxi origin-destination trips in NYC (a) January 2020; (b) April 2020; (c) July 2020
.JPG)
.JPG)
Figure 8: Group travel characteristics in 2019, 2020, and 2021 for NYC taxi trip data (a) number of trips in the group travel; (b) group travel rate
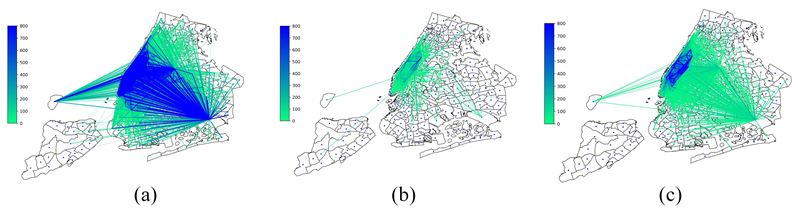
Figure 9: Geographic distribution of group travel for NYC taxi trip data (a) January 2020; (b) April 2020; (c) July 2020
.JPG)
.JPG)
Figure 10: Taxi trip distribution and group travel distribution at various stages during the pandemic
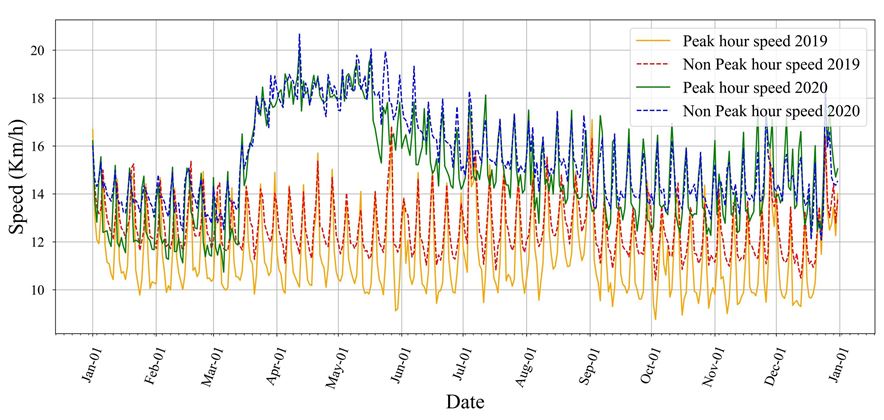
Figure 11: Peak hour speed and off-peak hour speed of NYC taxi trips in 2019 and 2020
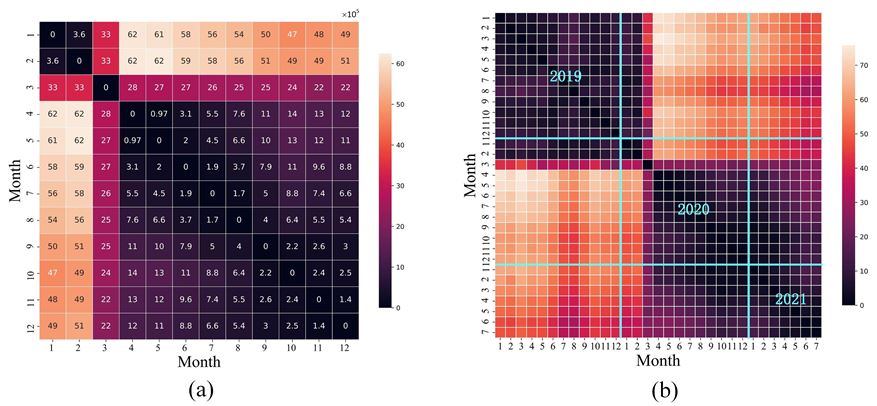
Figure 12: DTW distance of taxi trip demand at various stages of COVID-19
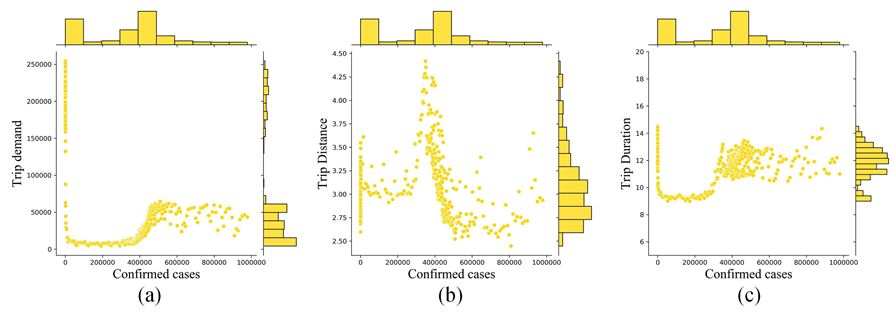
Figure 13: Correlation analysis of confirmed cases and taxi trip characteristics. (a) trip demand; (b) trip distance; (c) trip duration
Tables at a glance
Figures at a glance